

Statistical Thinking
Kelly McConville
Stat 100
Week 1 | Fall 2023
Getting Started in Stat 100
Step 1: Getting Started Module in Canvas

Stat 100 Tech & Materials

Research Interests
Survey statistics and collaborate with

Research Interests
Where survey statistics meets data science
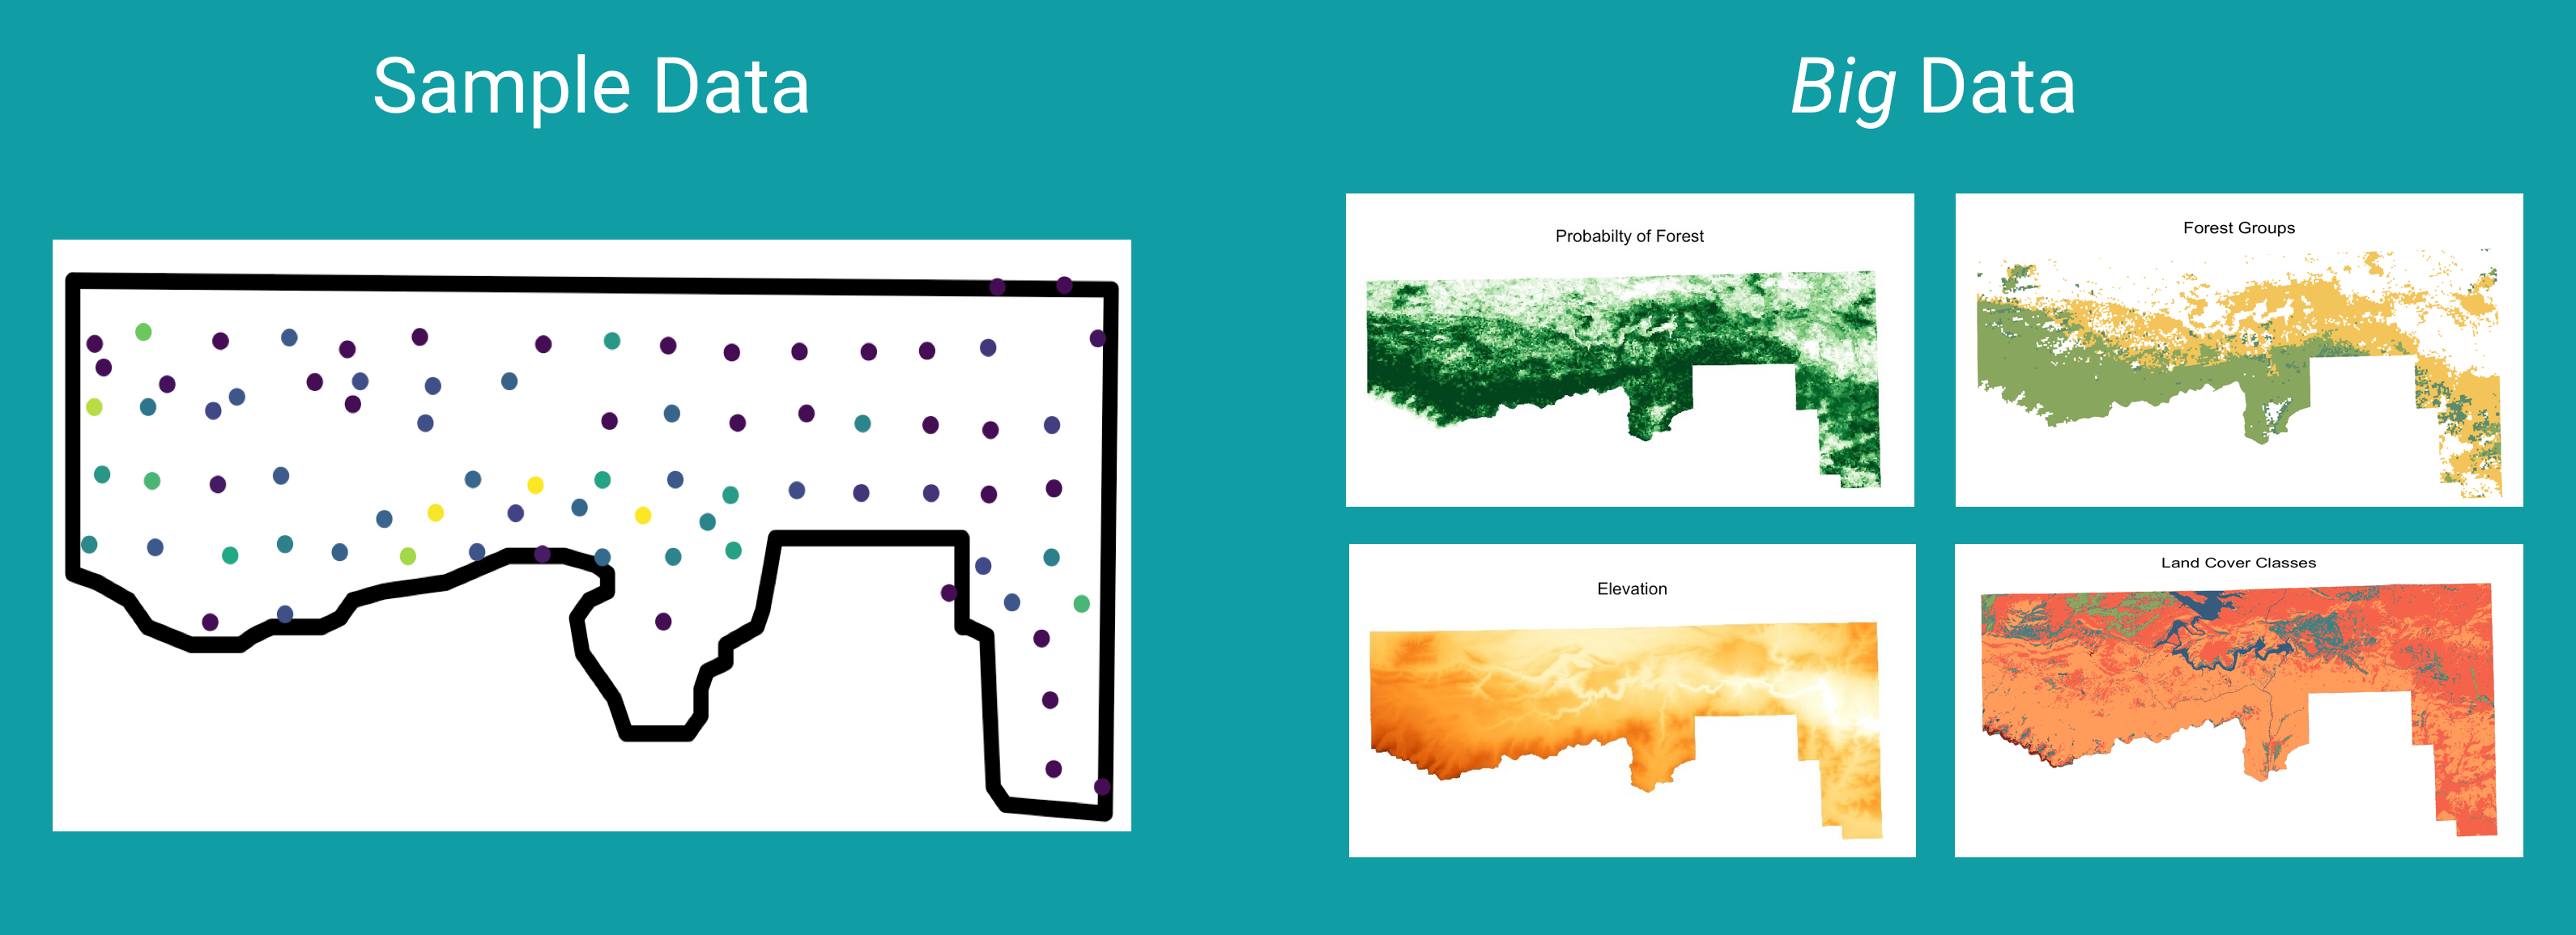
Advising Undergraduate Forestry Data Science Research


- I love teaching stats and coding.
- But, learning stats and coding is hard.
- With the right scaffolding, good strategies, and sustained effort, you can excel at both!
- And mistakes are part of the learning process. They don’t imply that you are bad at stats.
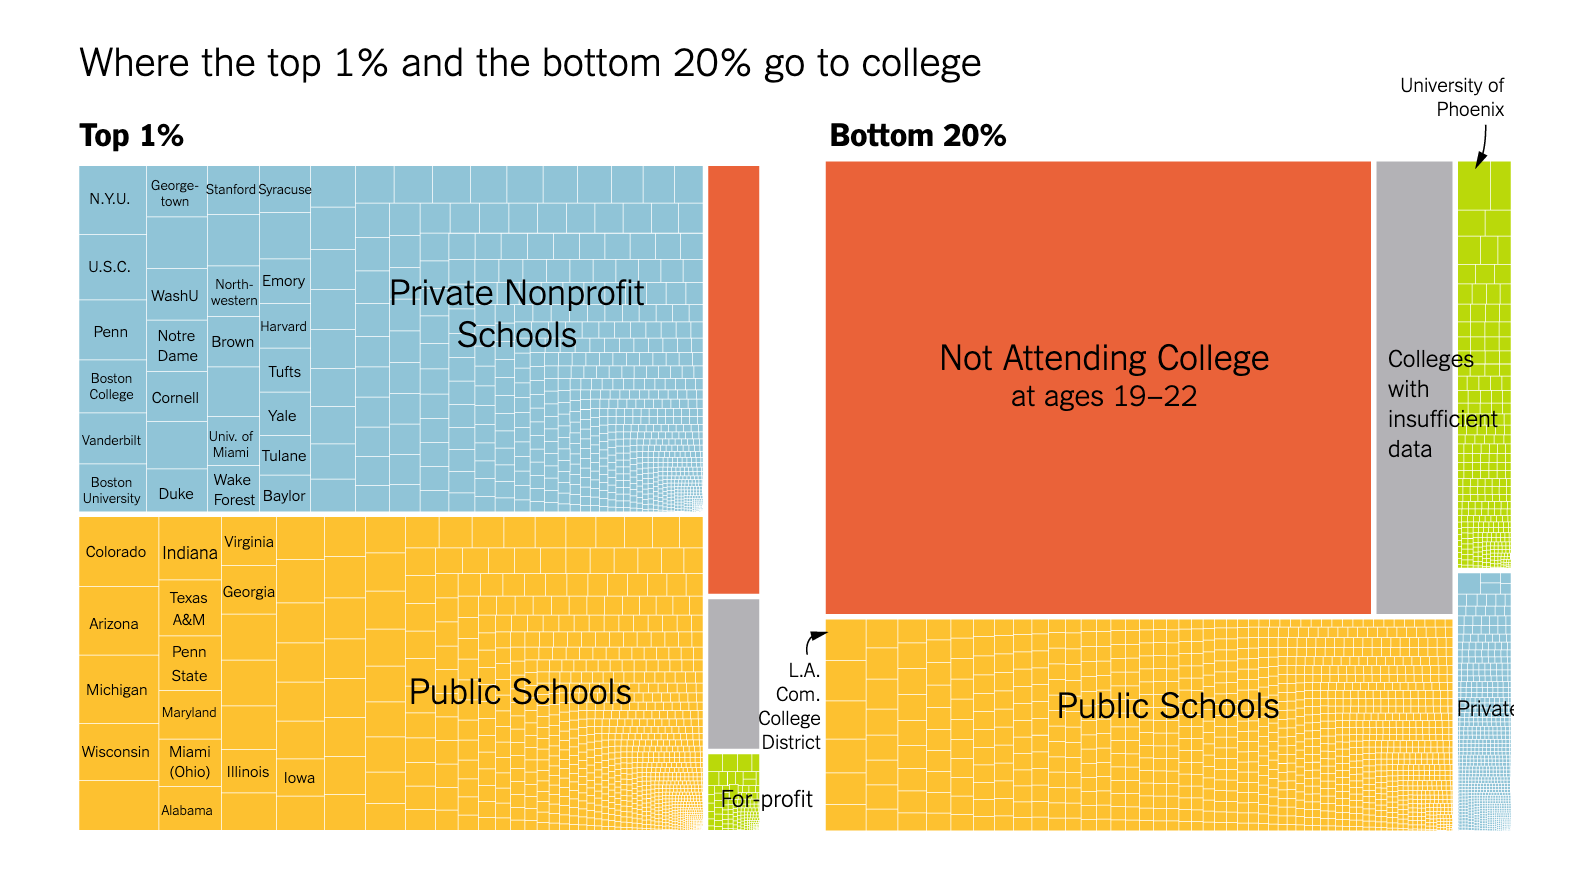
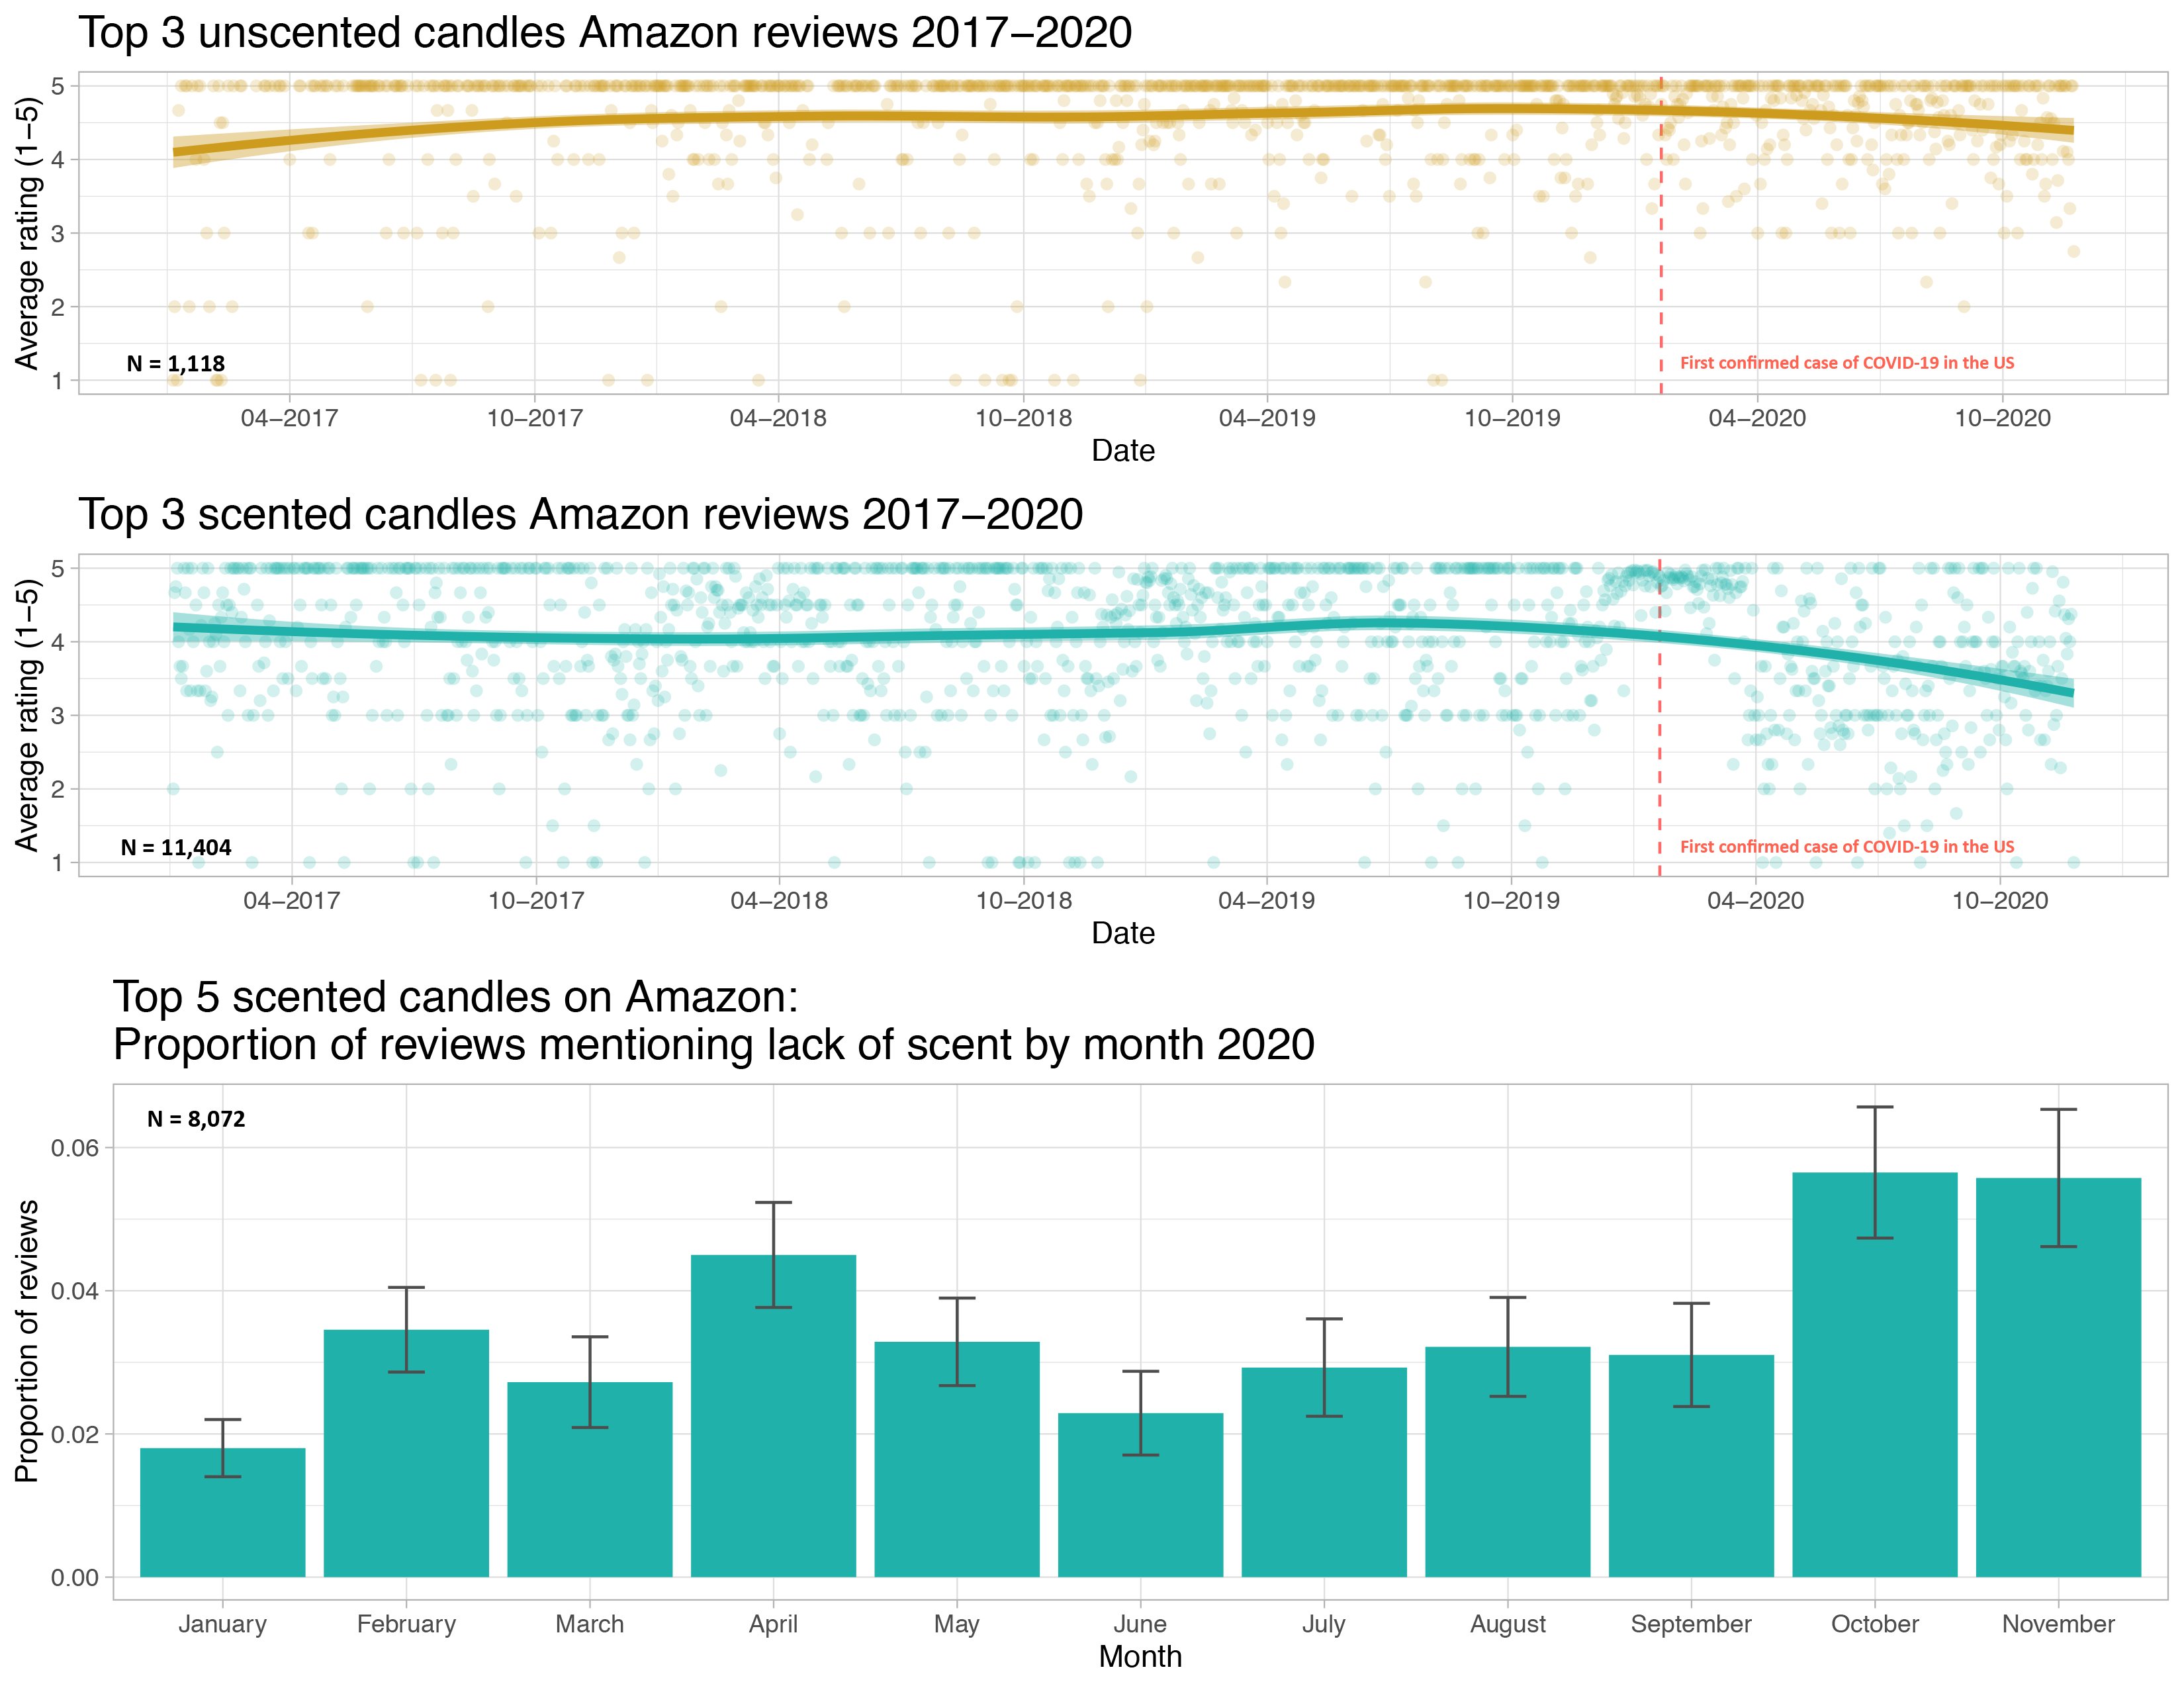
Data in Stat 100
Will use a wide-range of real and relevant data examples
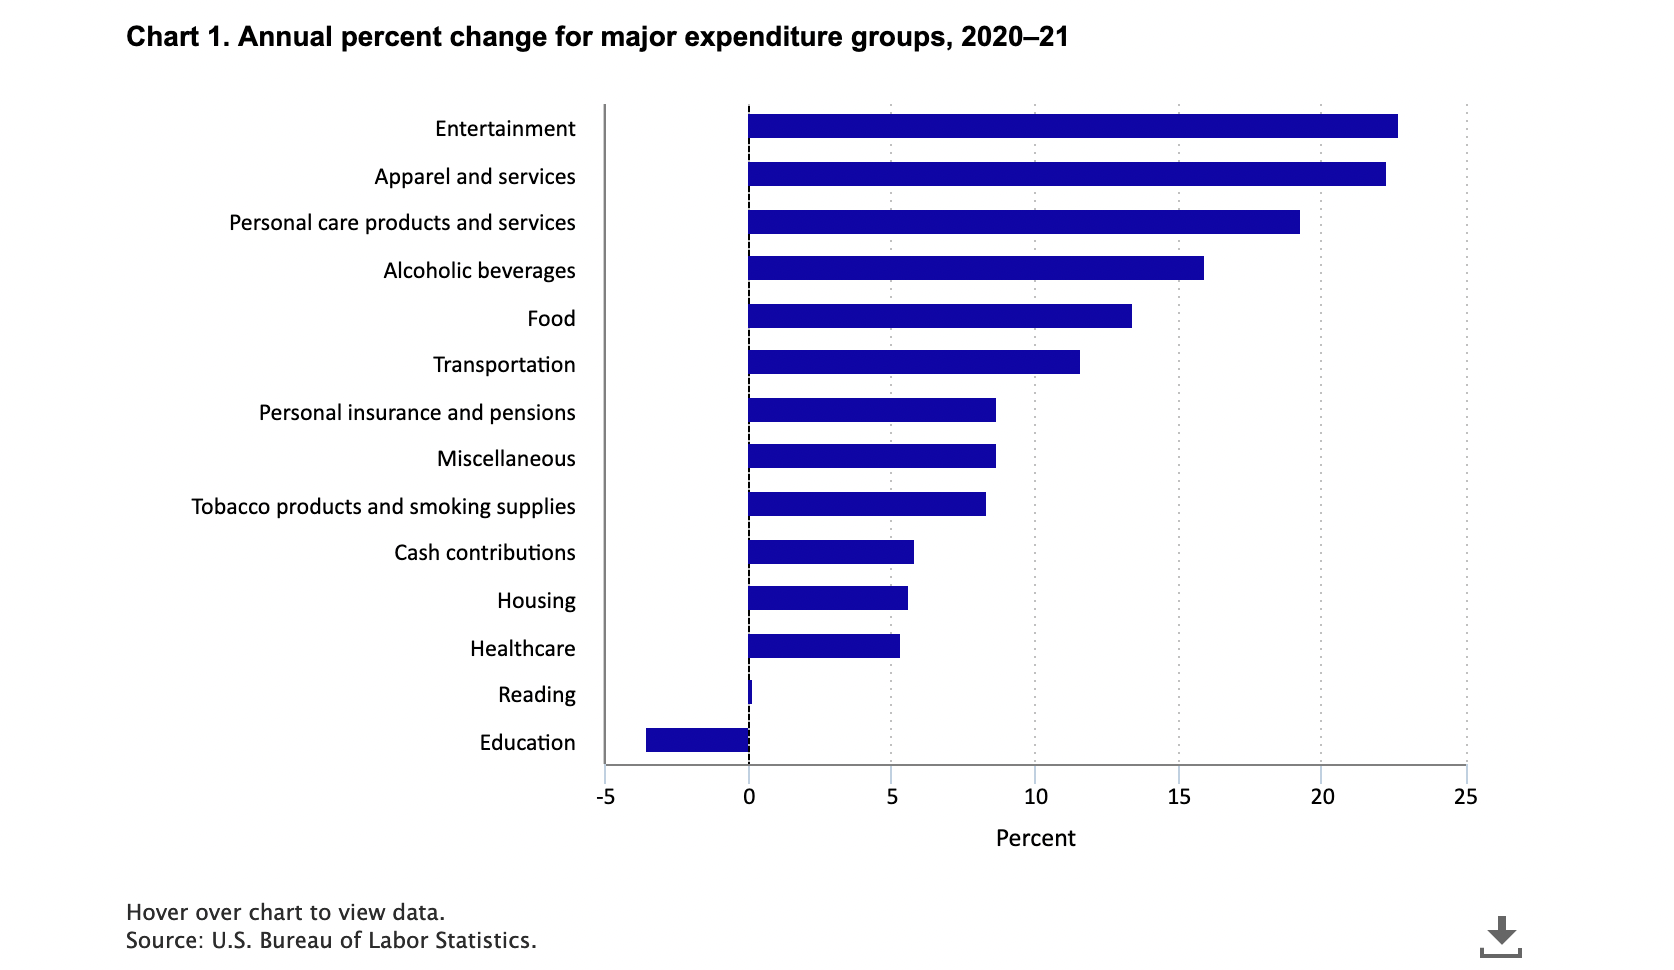
Data in Stat 100
I understand that some of these topics have likely had profound impacts on your lives.
We will focus class time on the key course objectives but will use these current topics to empower ourselves and to see how we can productively participate with data.
Example: Visualizing COVID Prevalence
- In May of 2020, the Georgia Department of Public Health posted the following graph:
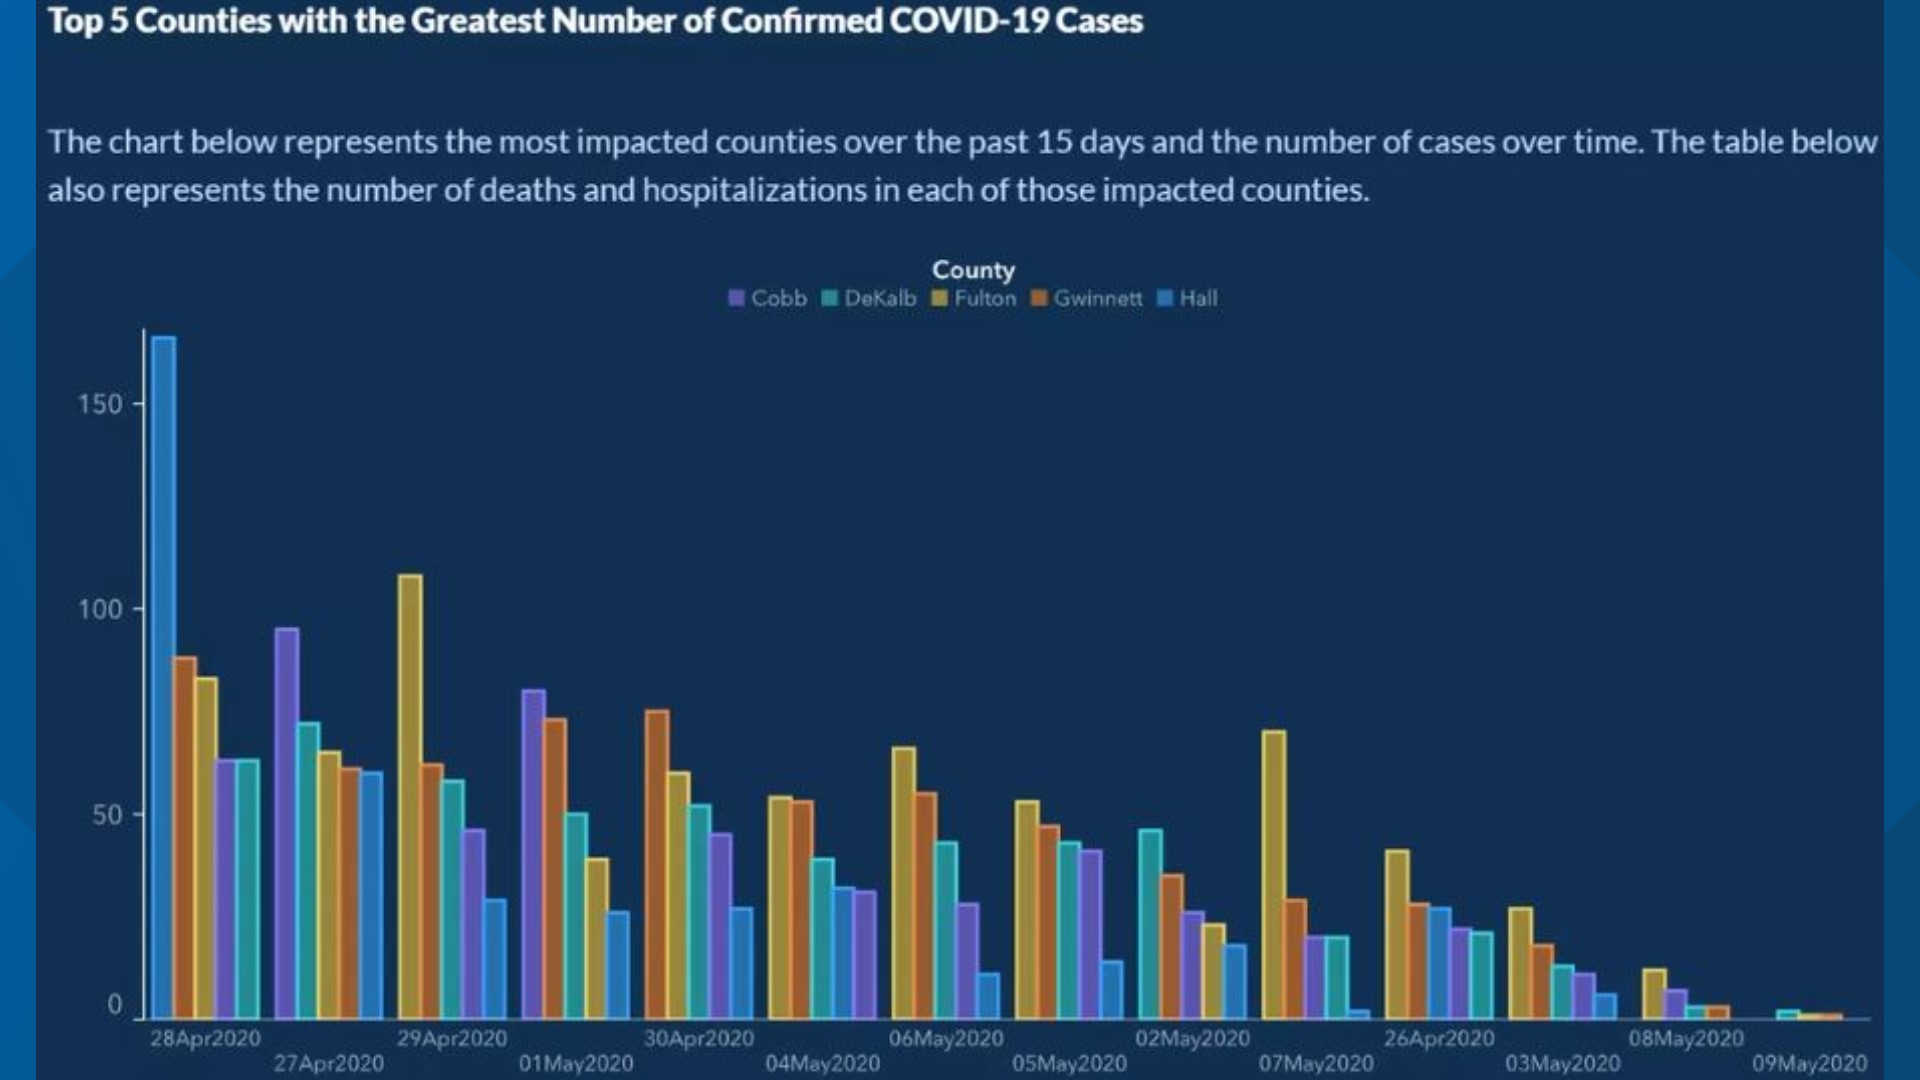
At a quick first glance, what story does the Georgia Department of Public Health graph appear to be telling?
What is misleading about the Georgia Department of Public Health graph? How could we fix this issue?
Example: Visualizing COVID Prevalence
- After public outcry, the Georgia Department of Public Health said they made a mistake and posted the following updated graph:

- How do your conclusions about COVID-19 cases in Georgia change when now interpreting this new graph?
Alberto Cairo, a journalist and designer, created the second graph of the Georgia COVID-19 data:
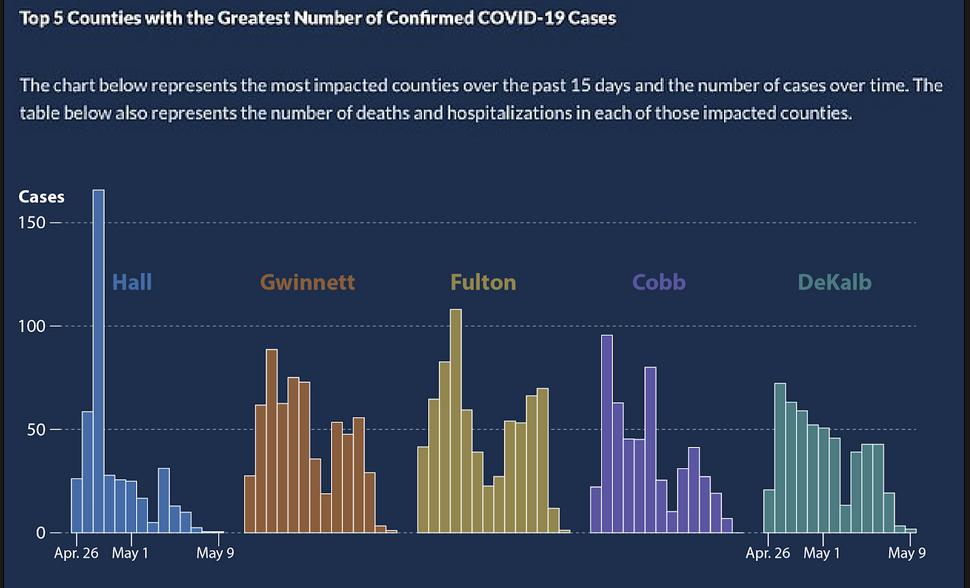
A key principle of data visualization is to “help the viewer make meaningful comparisons”.
What comparisons are made easy by the lefthand graph? What about by the righthand graph?
From these graphs, can we get an accurate estimate of the COVID prevalence in these Georgian counties over this two week period?
Example: Visualizing COVID Prevalence
- The Massachusetts Water Resources Authority (MWRA) graph tracks the presence of COVID-19 in the Boston-area wastewater.
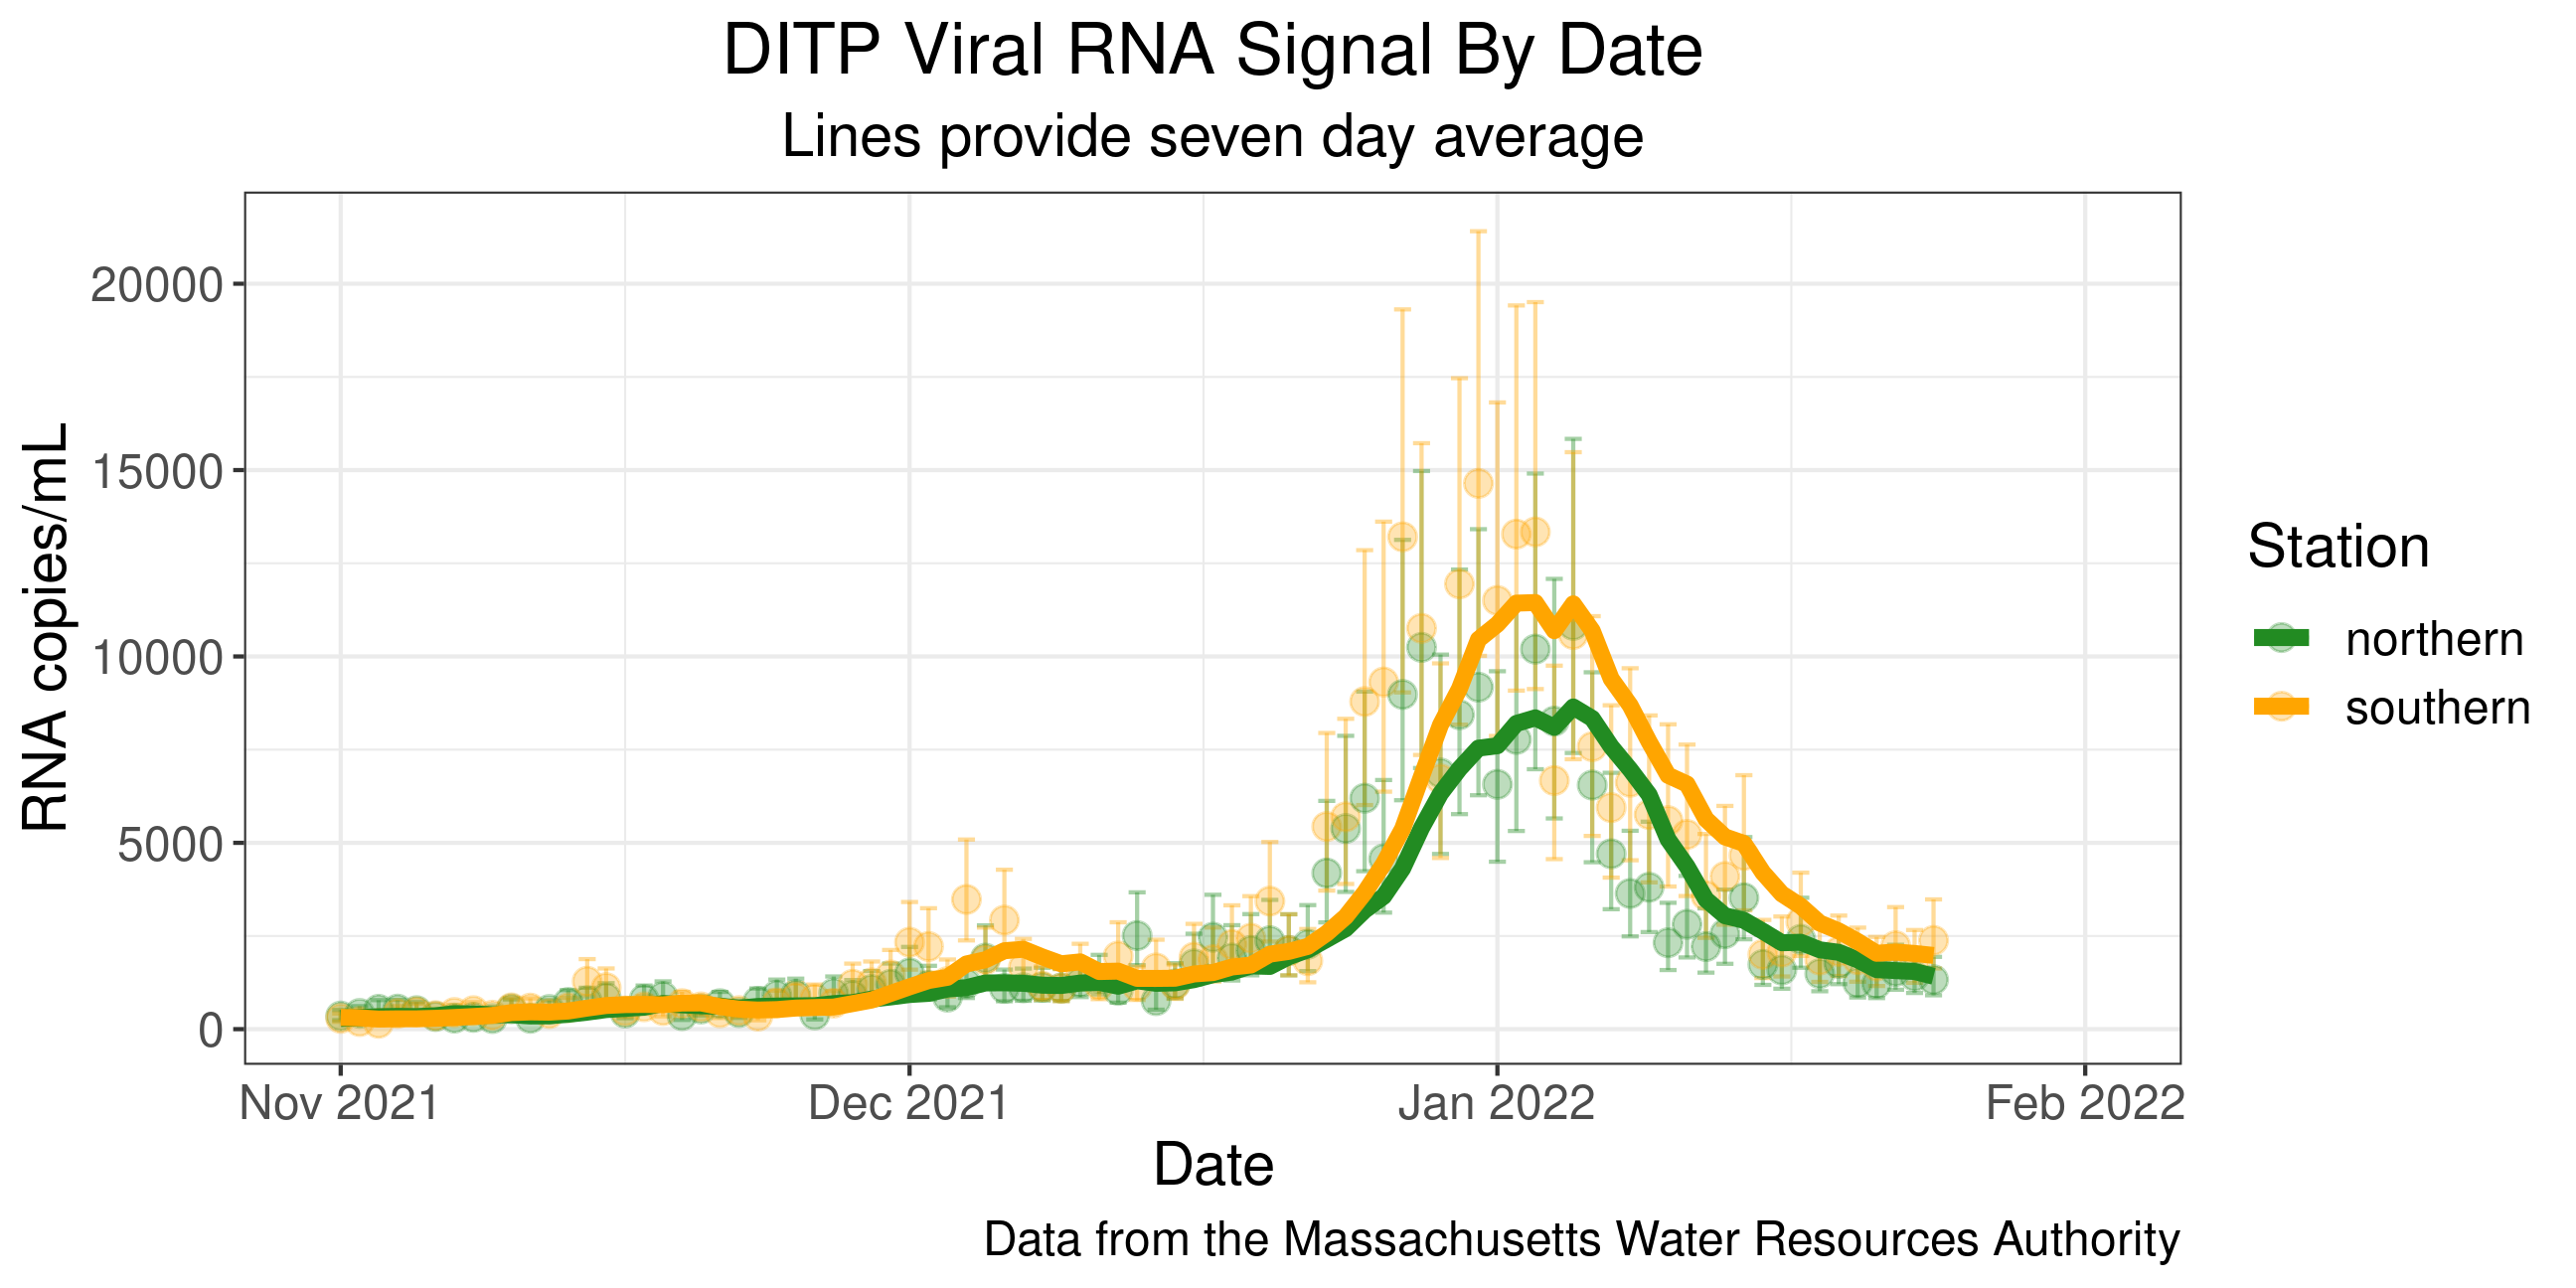
What are the pros of using wastewater over nasal swabs to assess COVID prevalence? What are the cons?
One more note: The graph also incorporates uncertainty measures, a key statistical thinking idea that we will learn more about later in the semester!
Dear Data Examples

Dear Data Examples

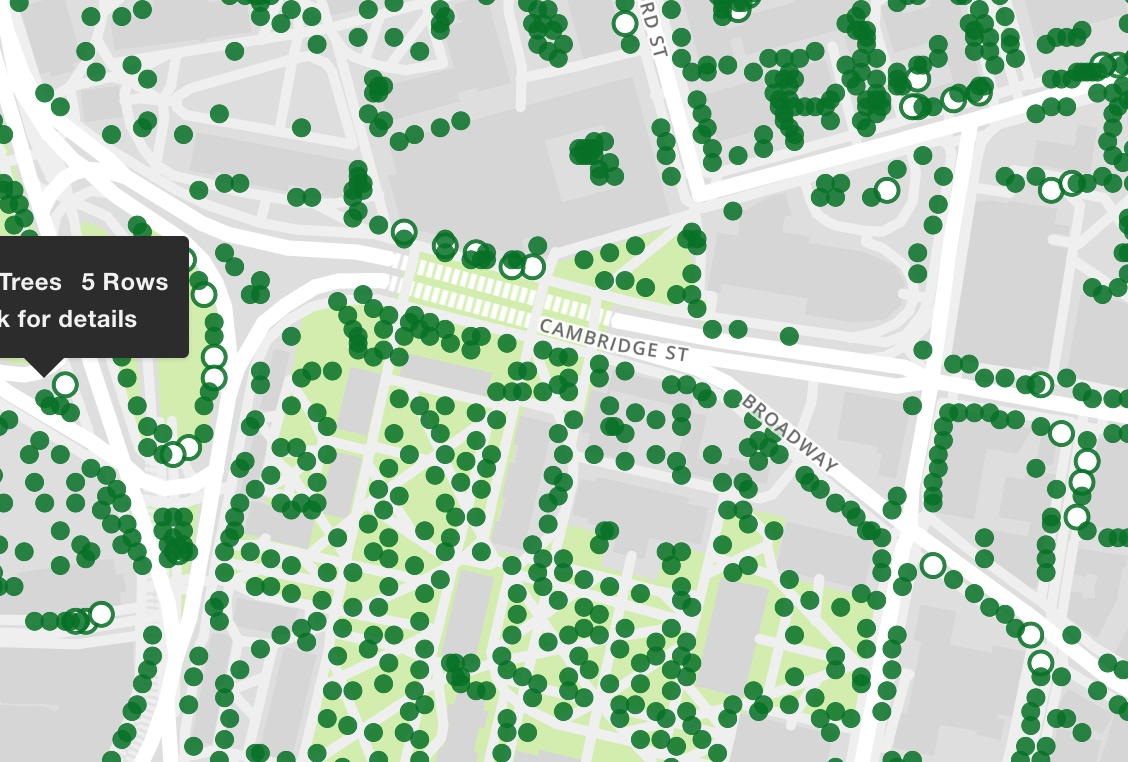
More Dear Data Examples
- Becky Cooper handed out hand-drawn maps of Manhattan to strangers and asked them to “map their Manhattan.”
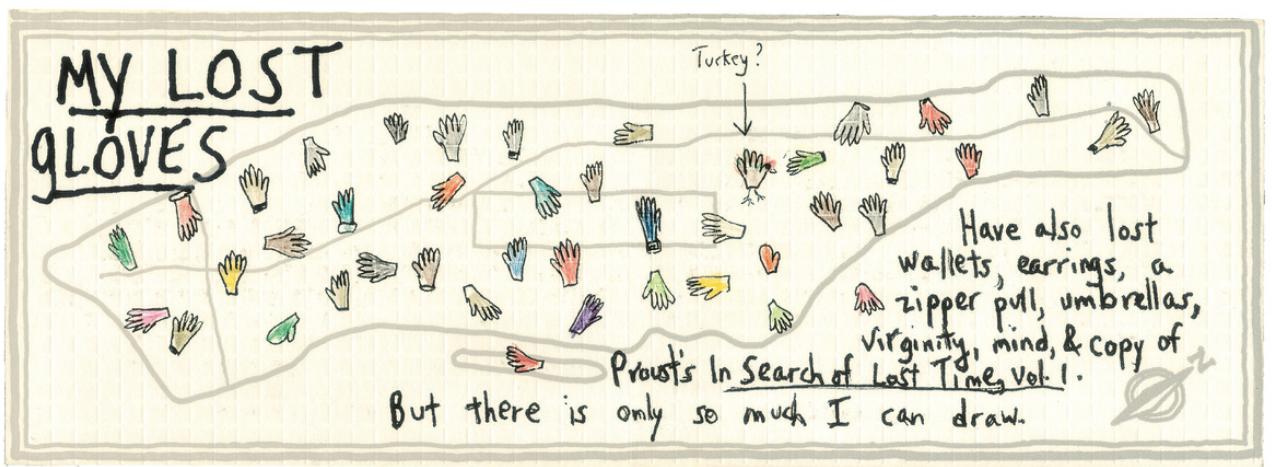
- What would the data frame for this visualization look like?
More Dear Data Examples
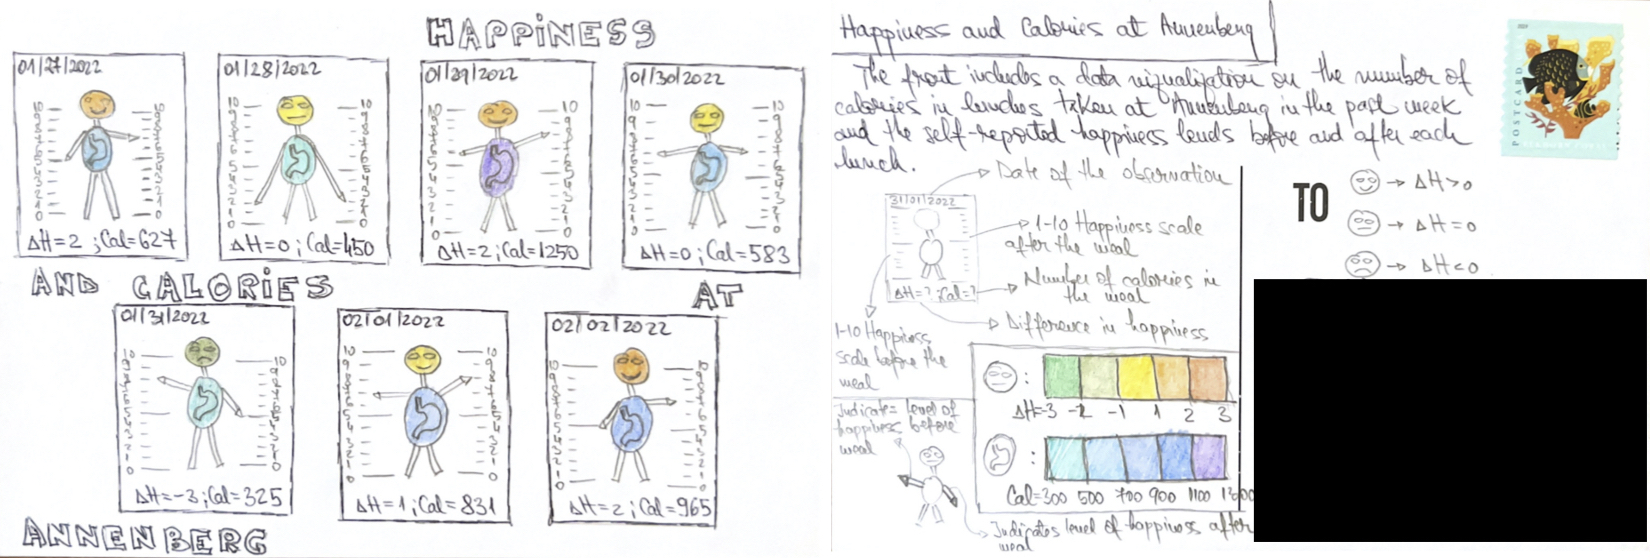
- What would the data frame for this visualization look like?
More Dear Data Examples
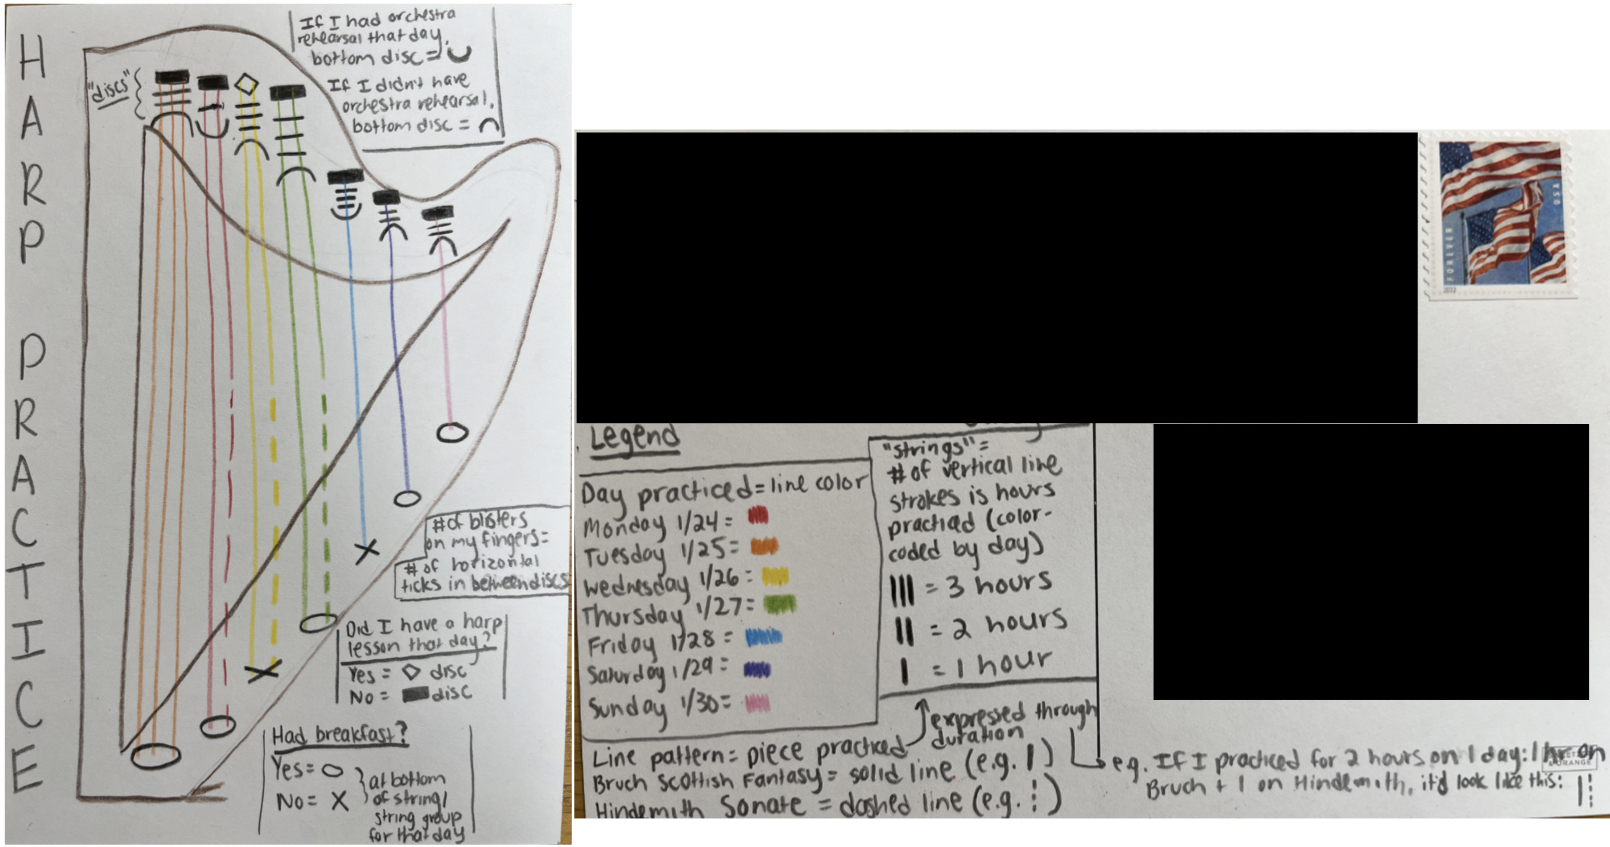
- What would the data frame for this visualization look like?