
More Data Collection
Kelly McConville
Stat 100
Week 5 | Fall 2023
Careful Using Non-Simple Random Sample Data
- If you are dealing with data collected using a complex sampling design, I’d recommend taking an additional stats course, like Stat 160: Intro to Survey Sampling & Estimation!
Responsibilities to Research Subjects
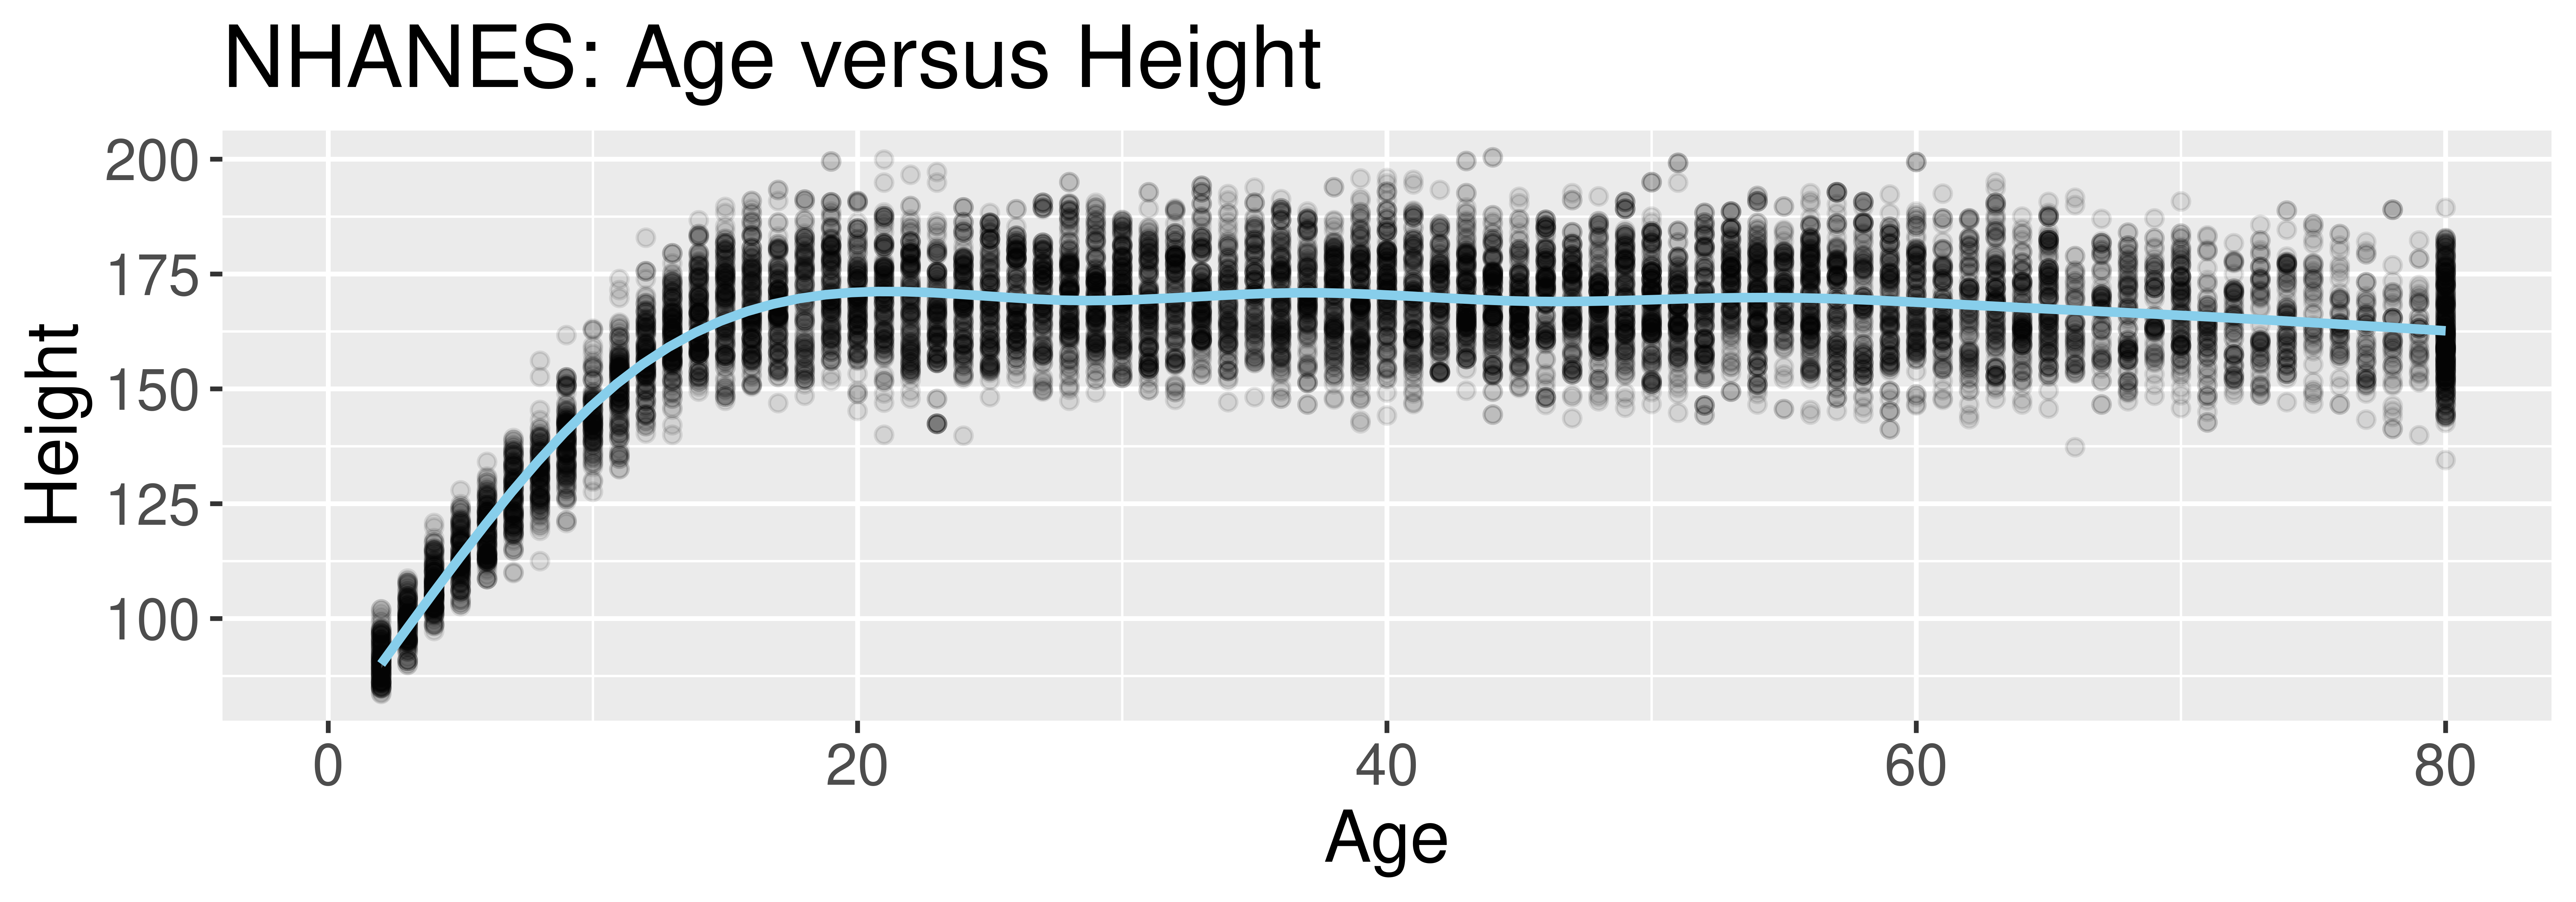
Why do you think the Age variable maxes out at 80?
“Protects the privacy and confidentiality of research subjects and data concerning them, whether obtained from the subjects directly, other persons, or existing records.”
Detour from Our Detour
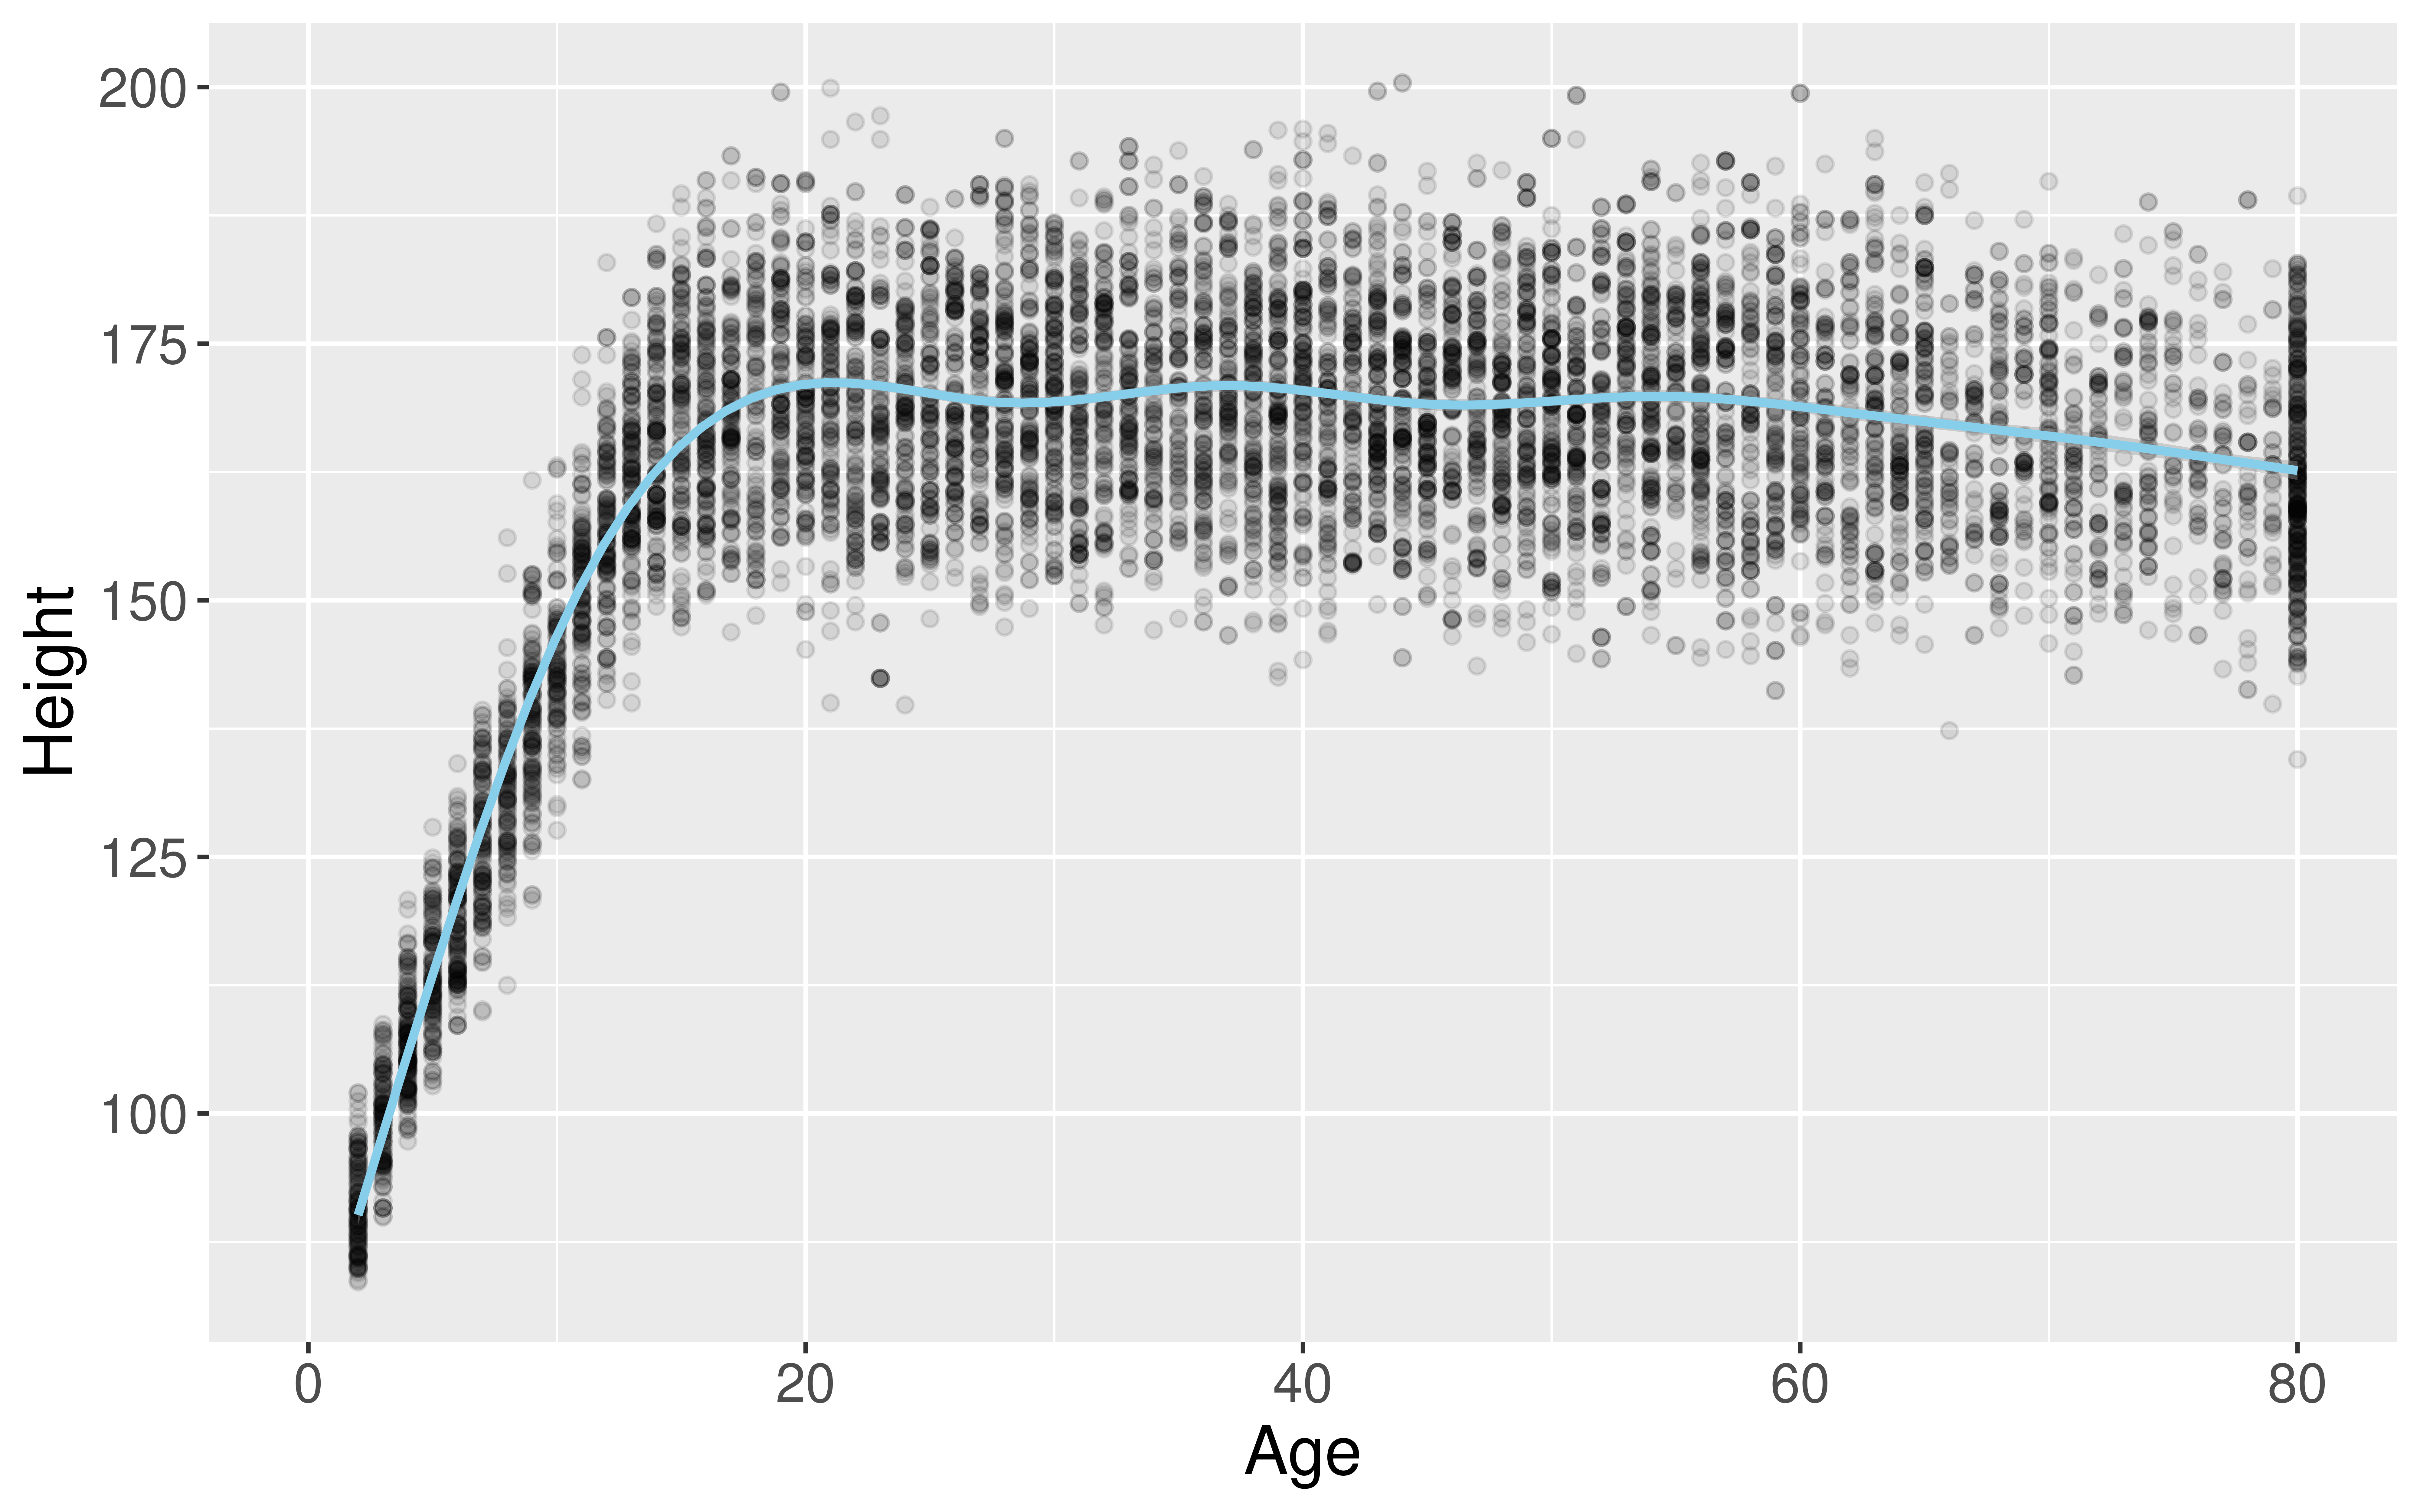
Detour from Our Detour
library(tidyverse)
library(NHANES)
library(emojifont)

NHANES <- mutate(NHANES,
          heart = fontawesome("fa-pumpkin"))

ggplot(data = NHANES,
       mapping = aes(x = Age,
                     y = Height,
                     label = heart)) +
  geom_text(alpha = 0.1, color = "red",
            family='fontawesome-webfont',
            size = 16) +
  stat_smooth(color = "deeppink")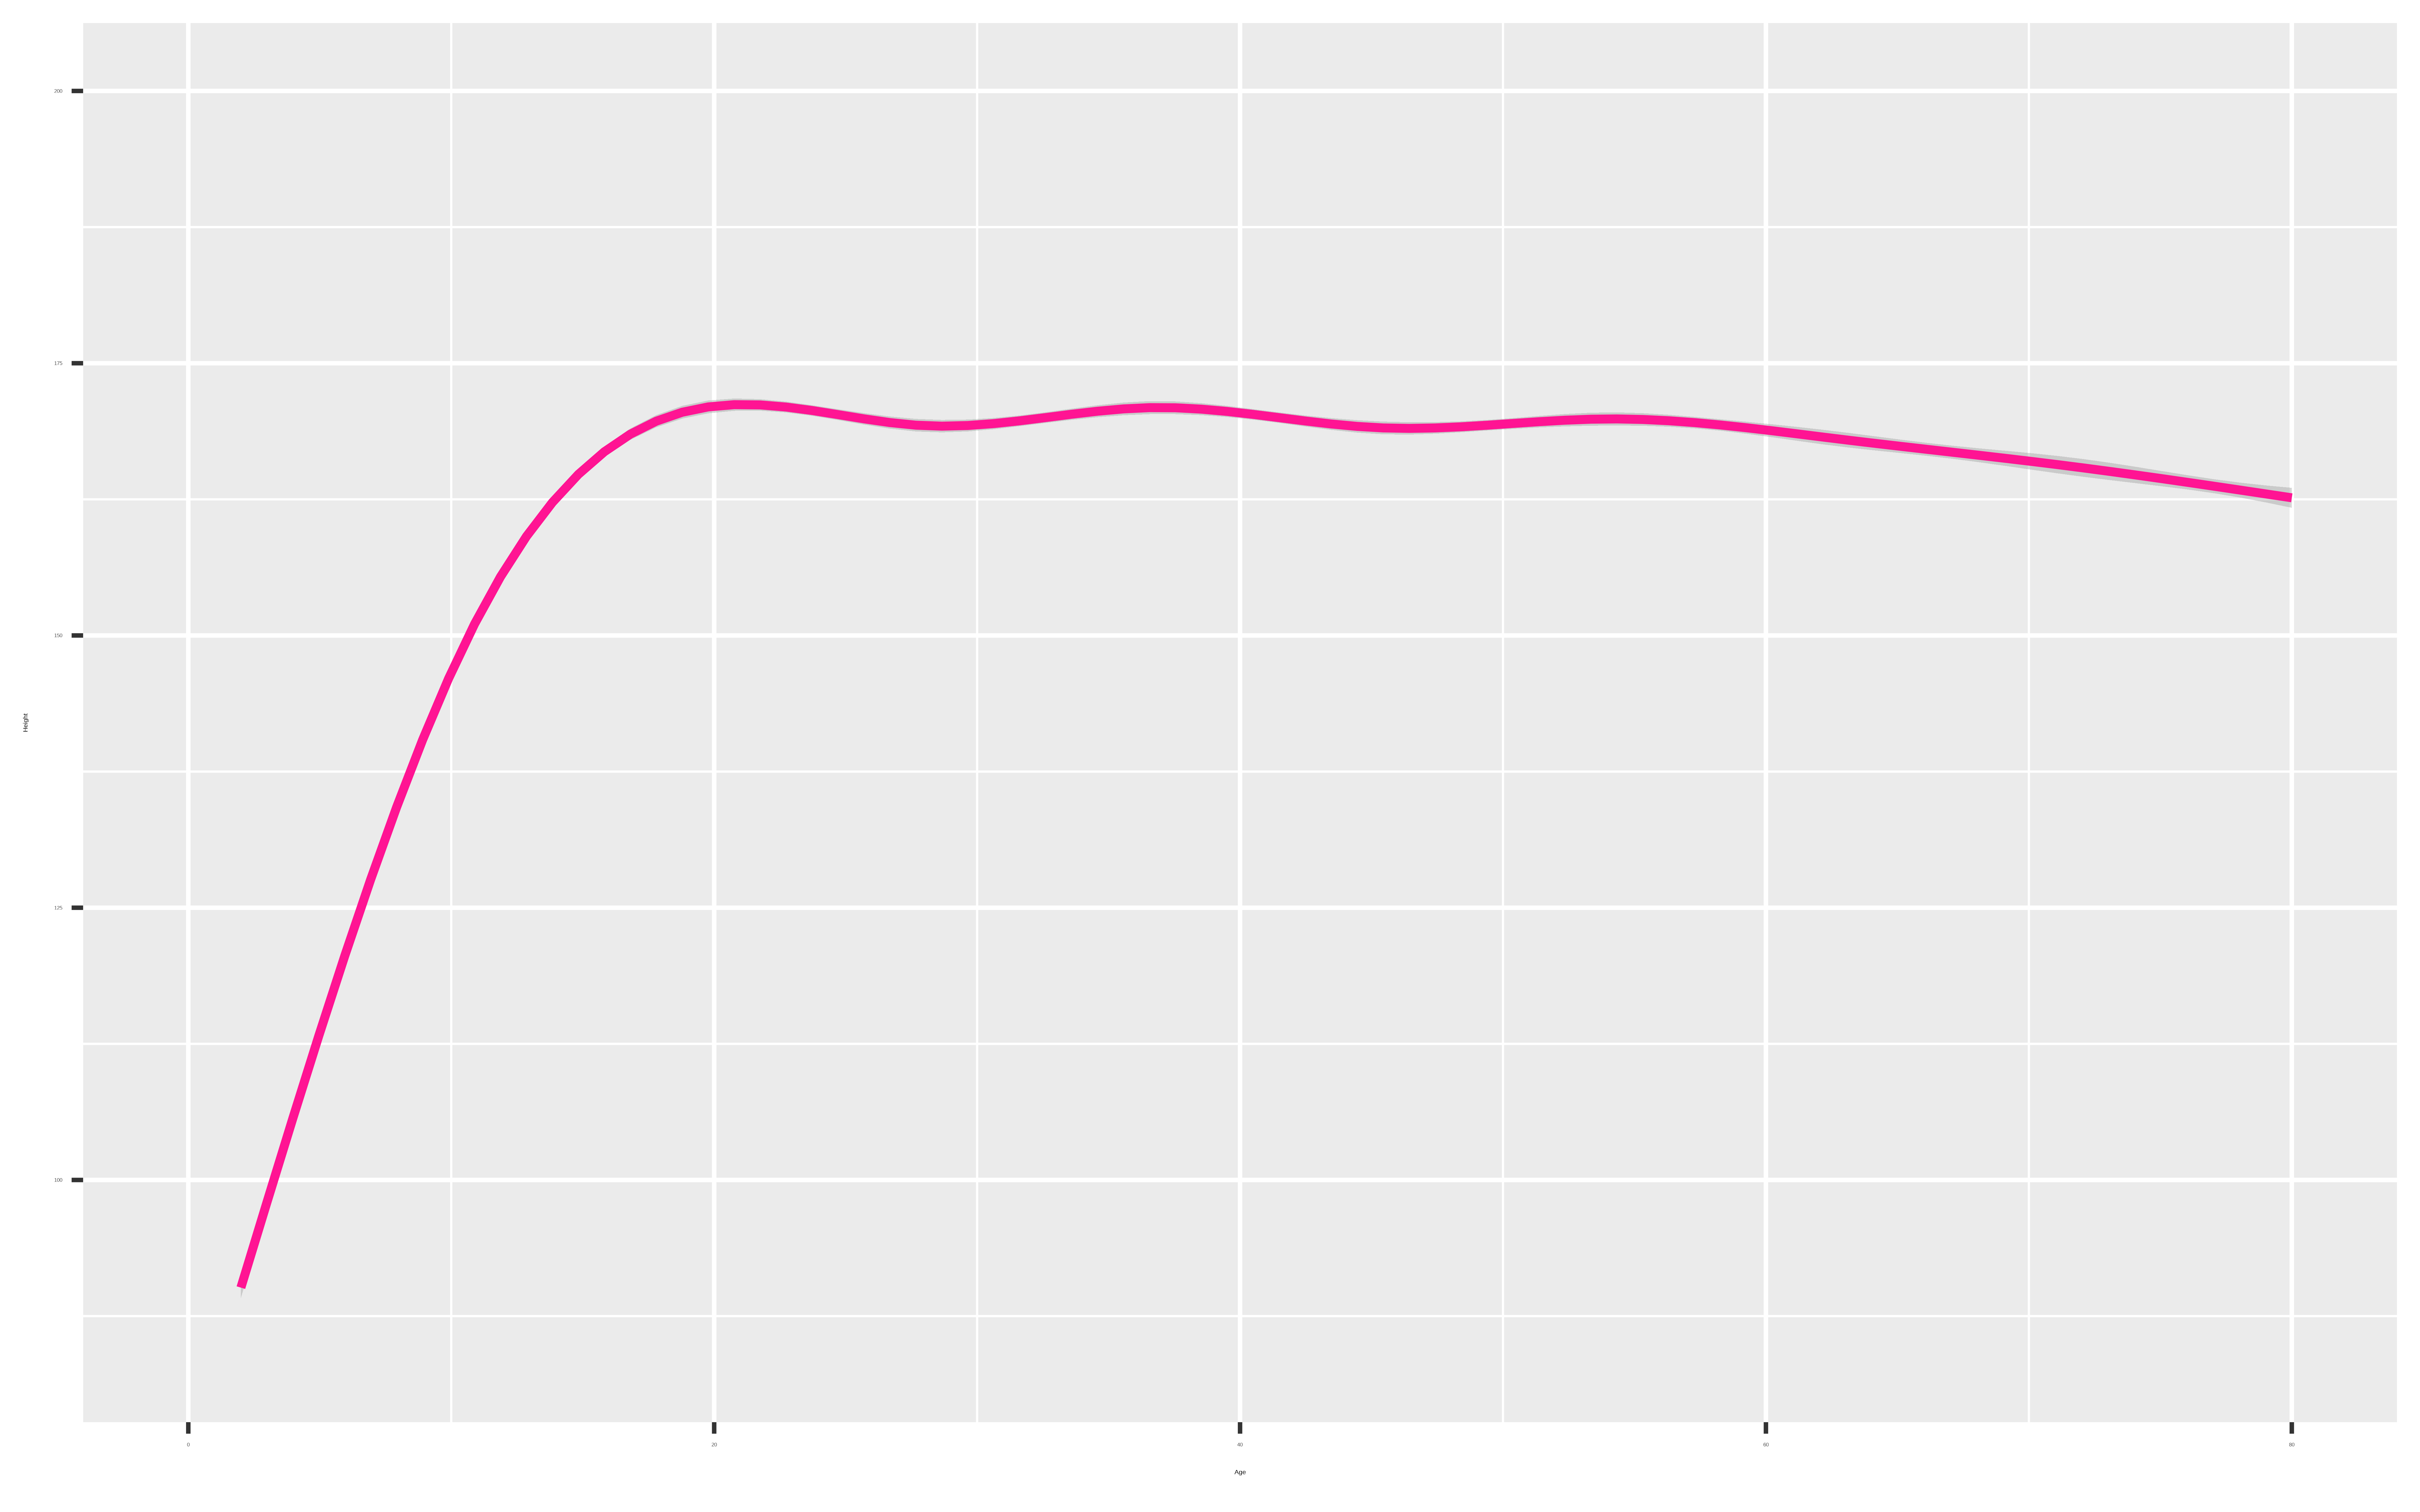
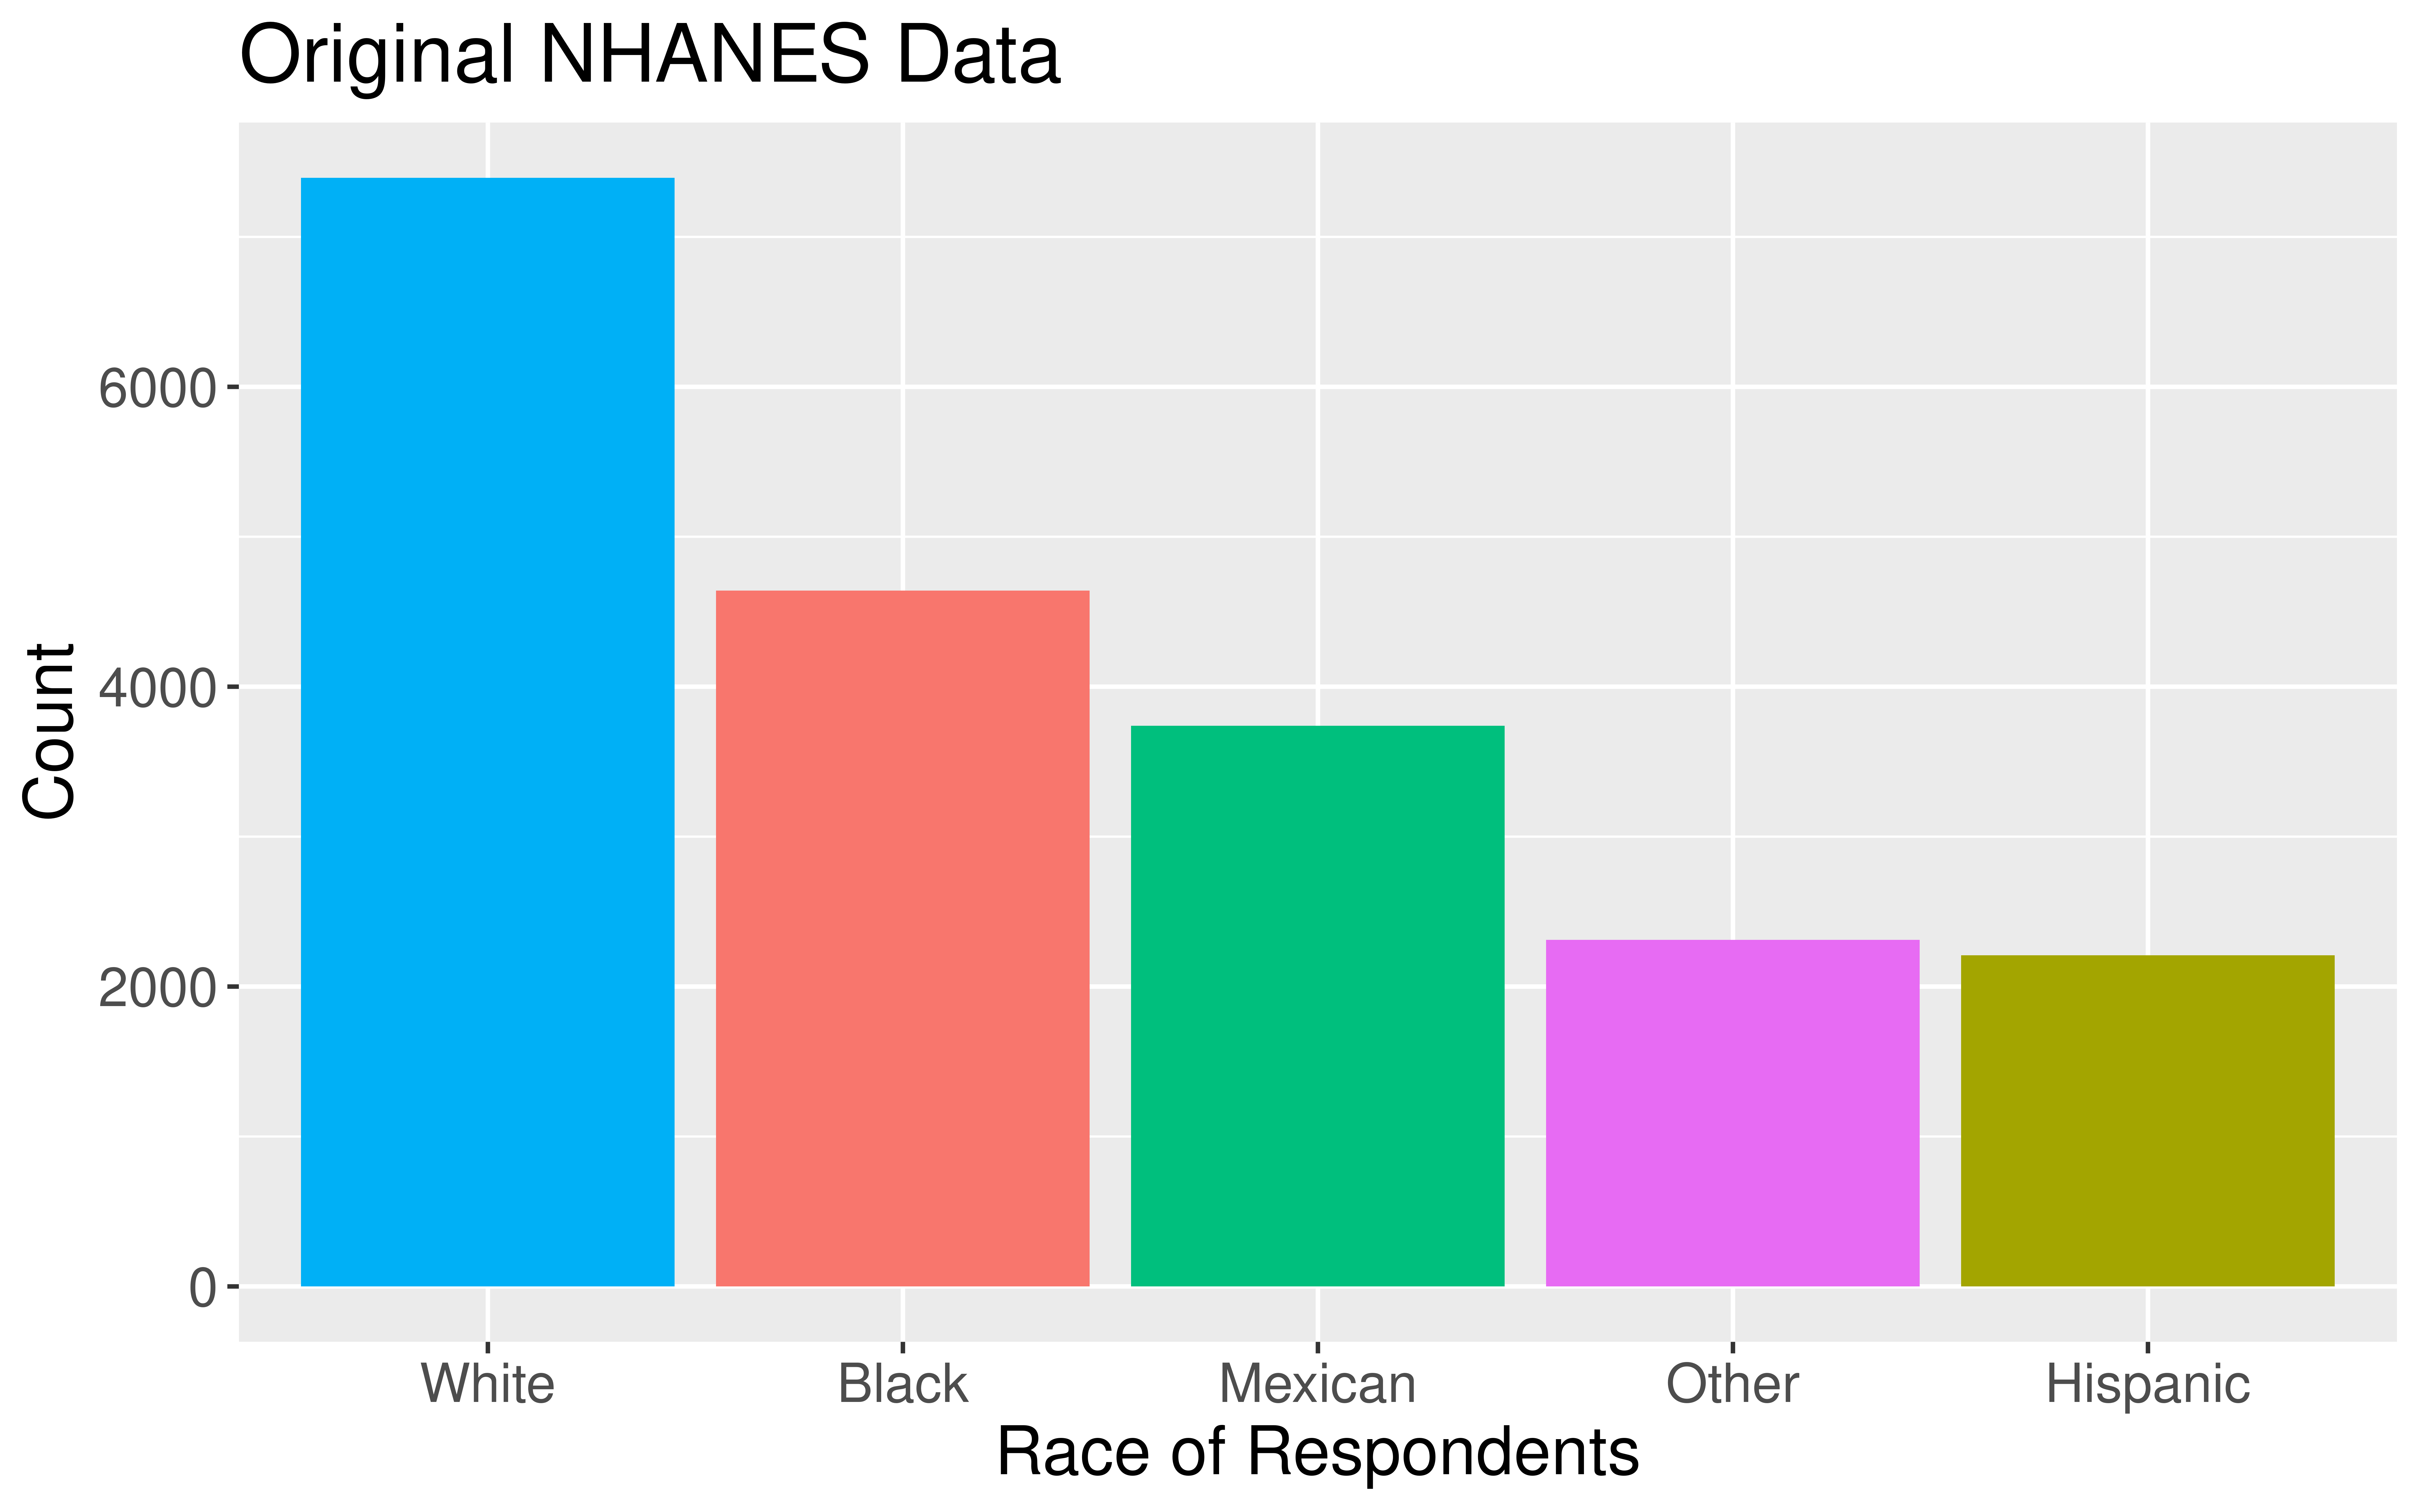
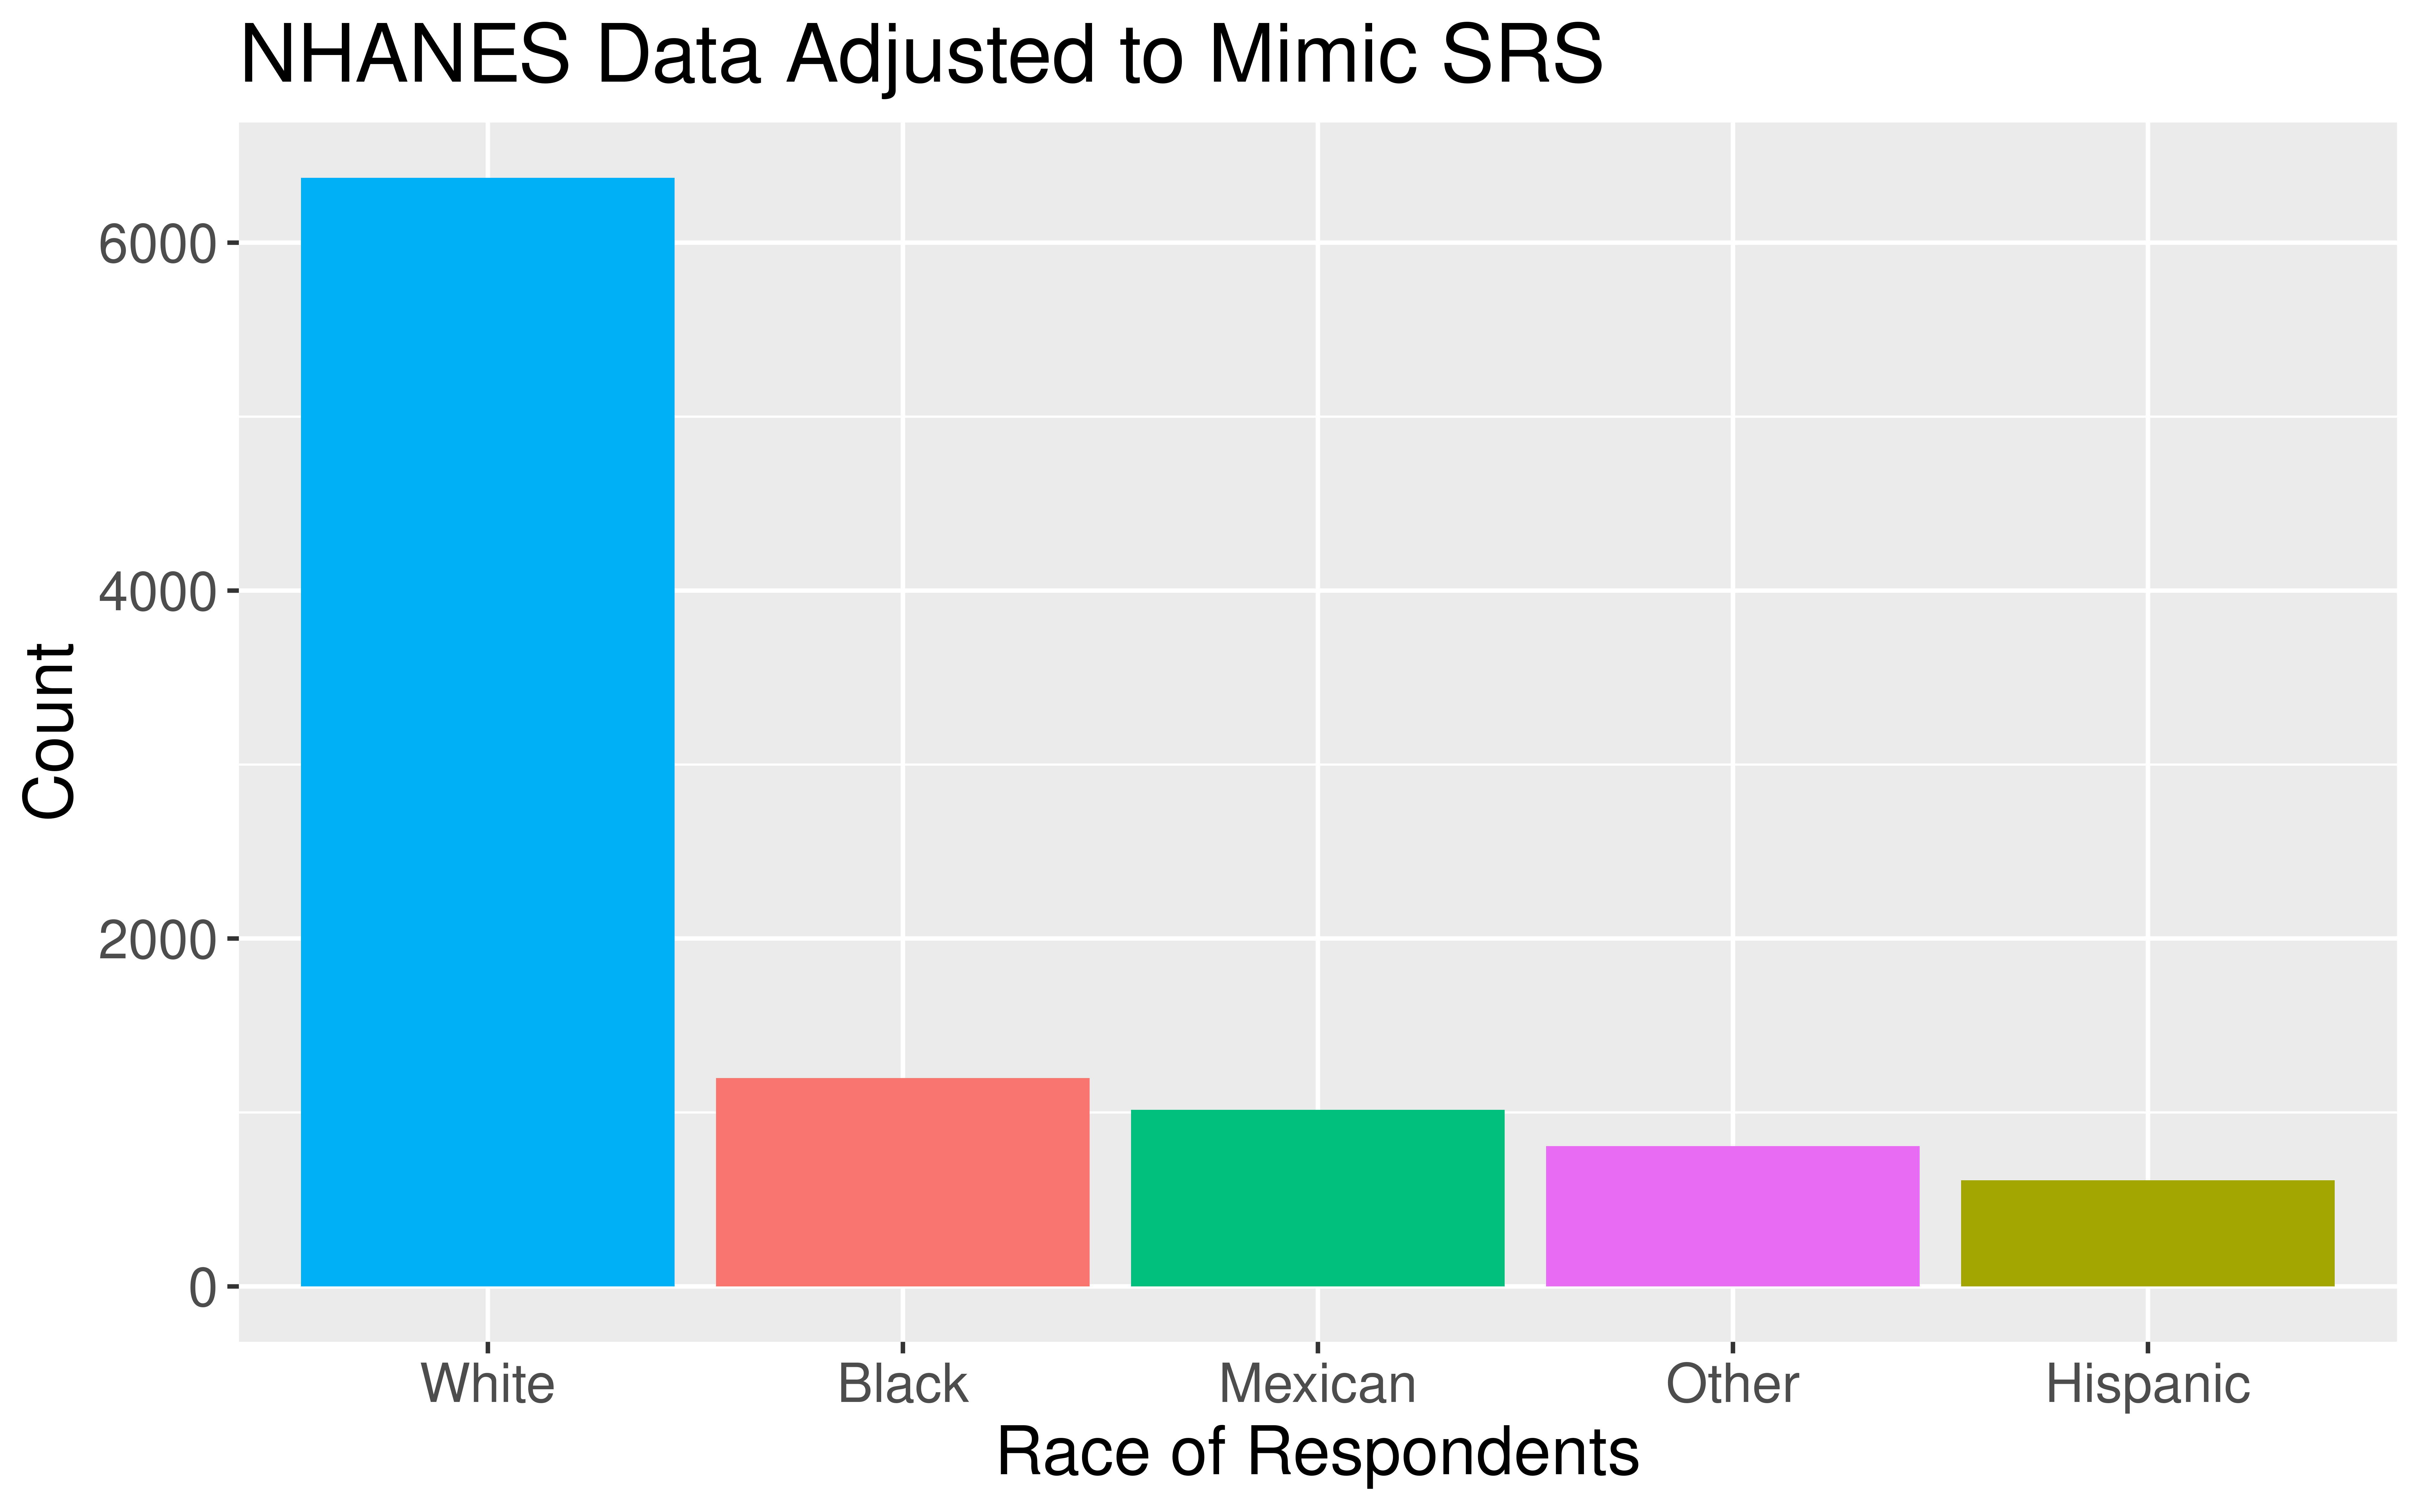
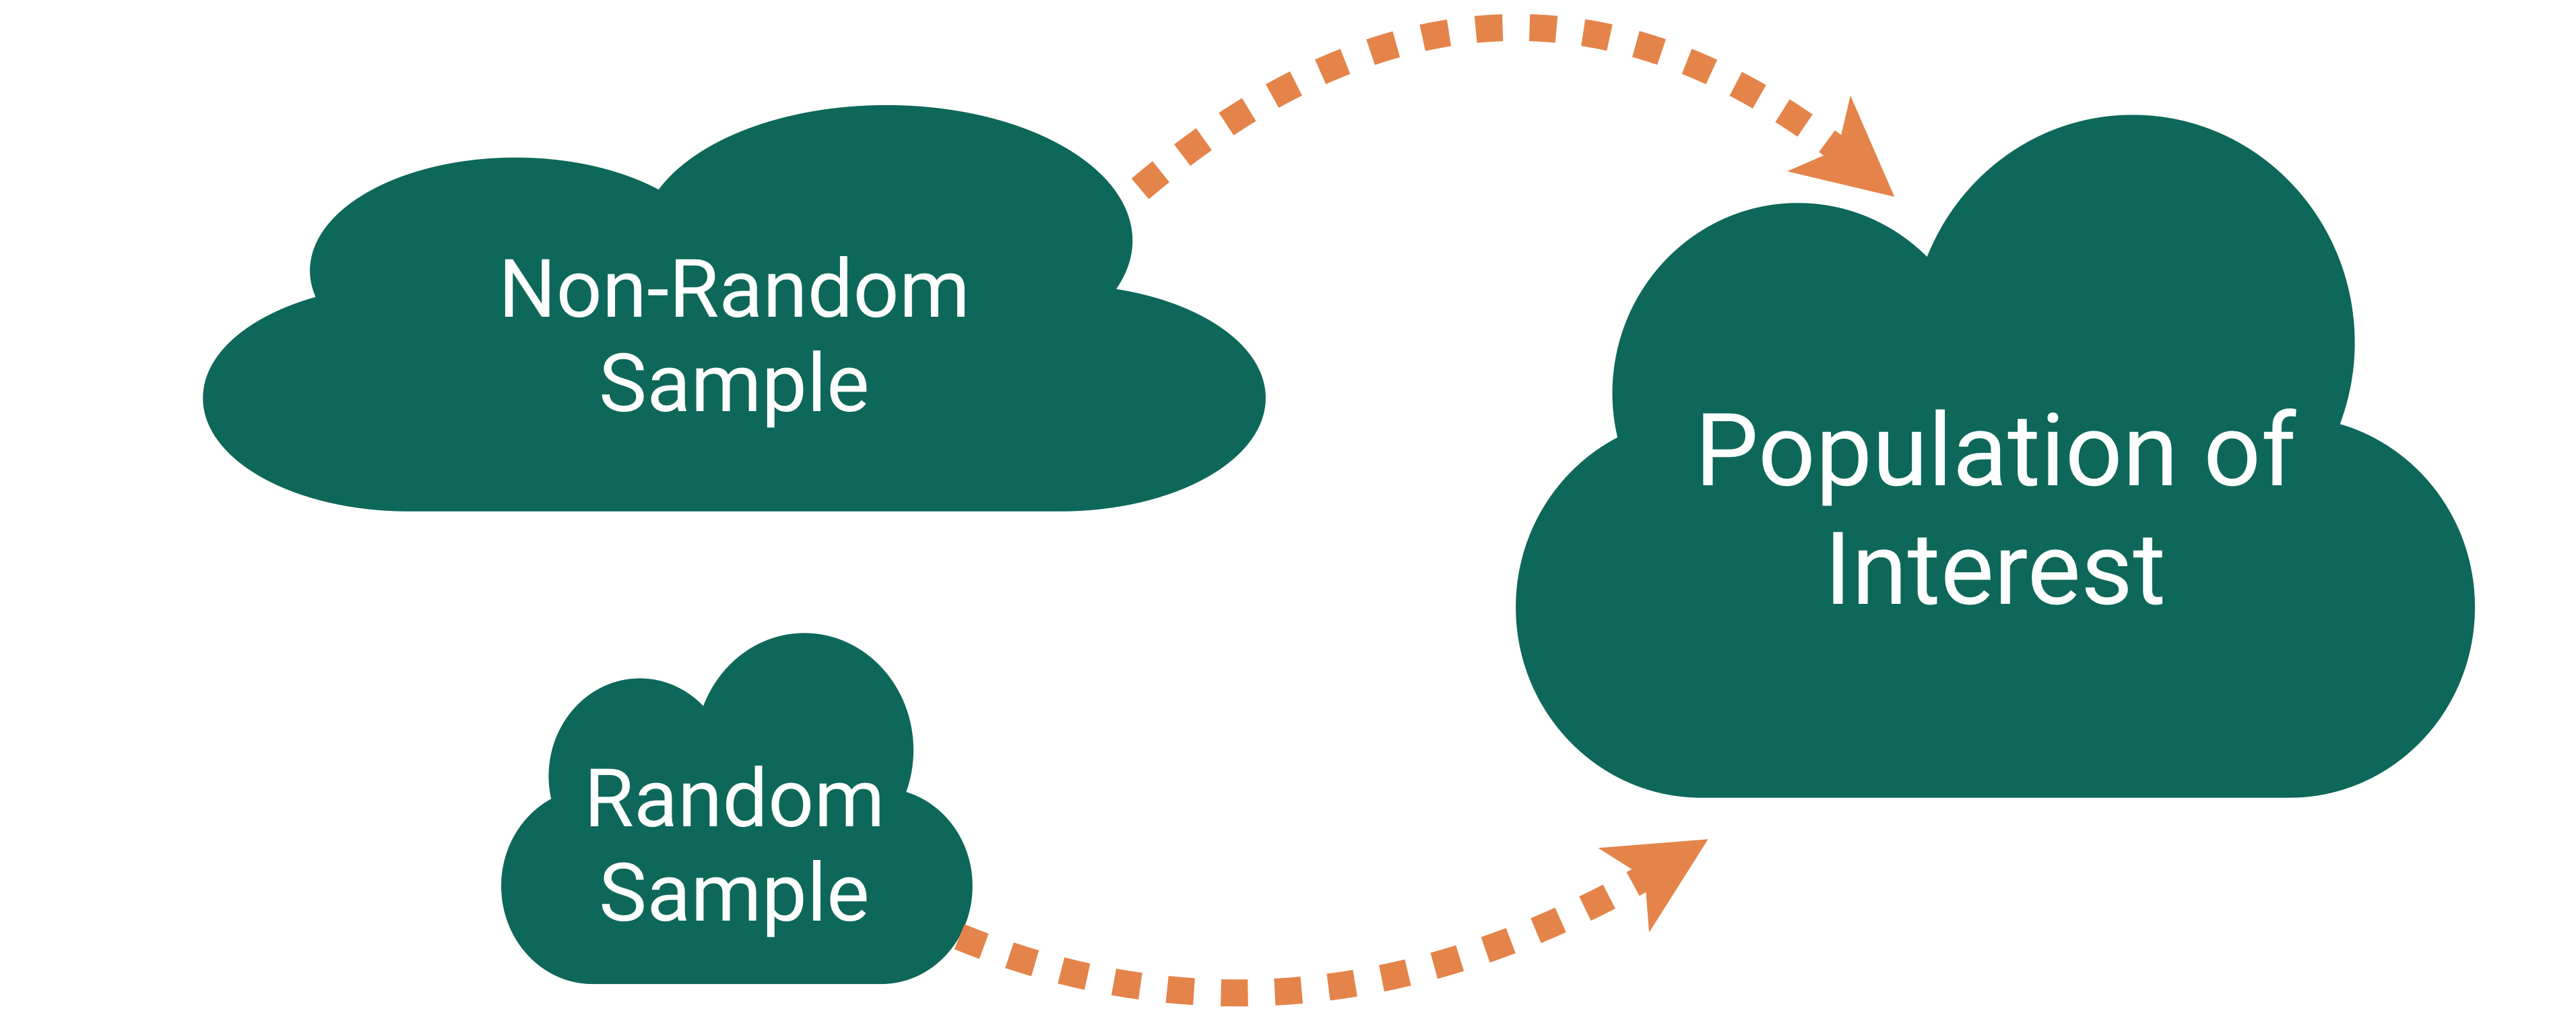
Who are the data supposed to represent?
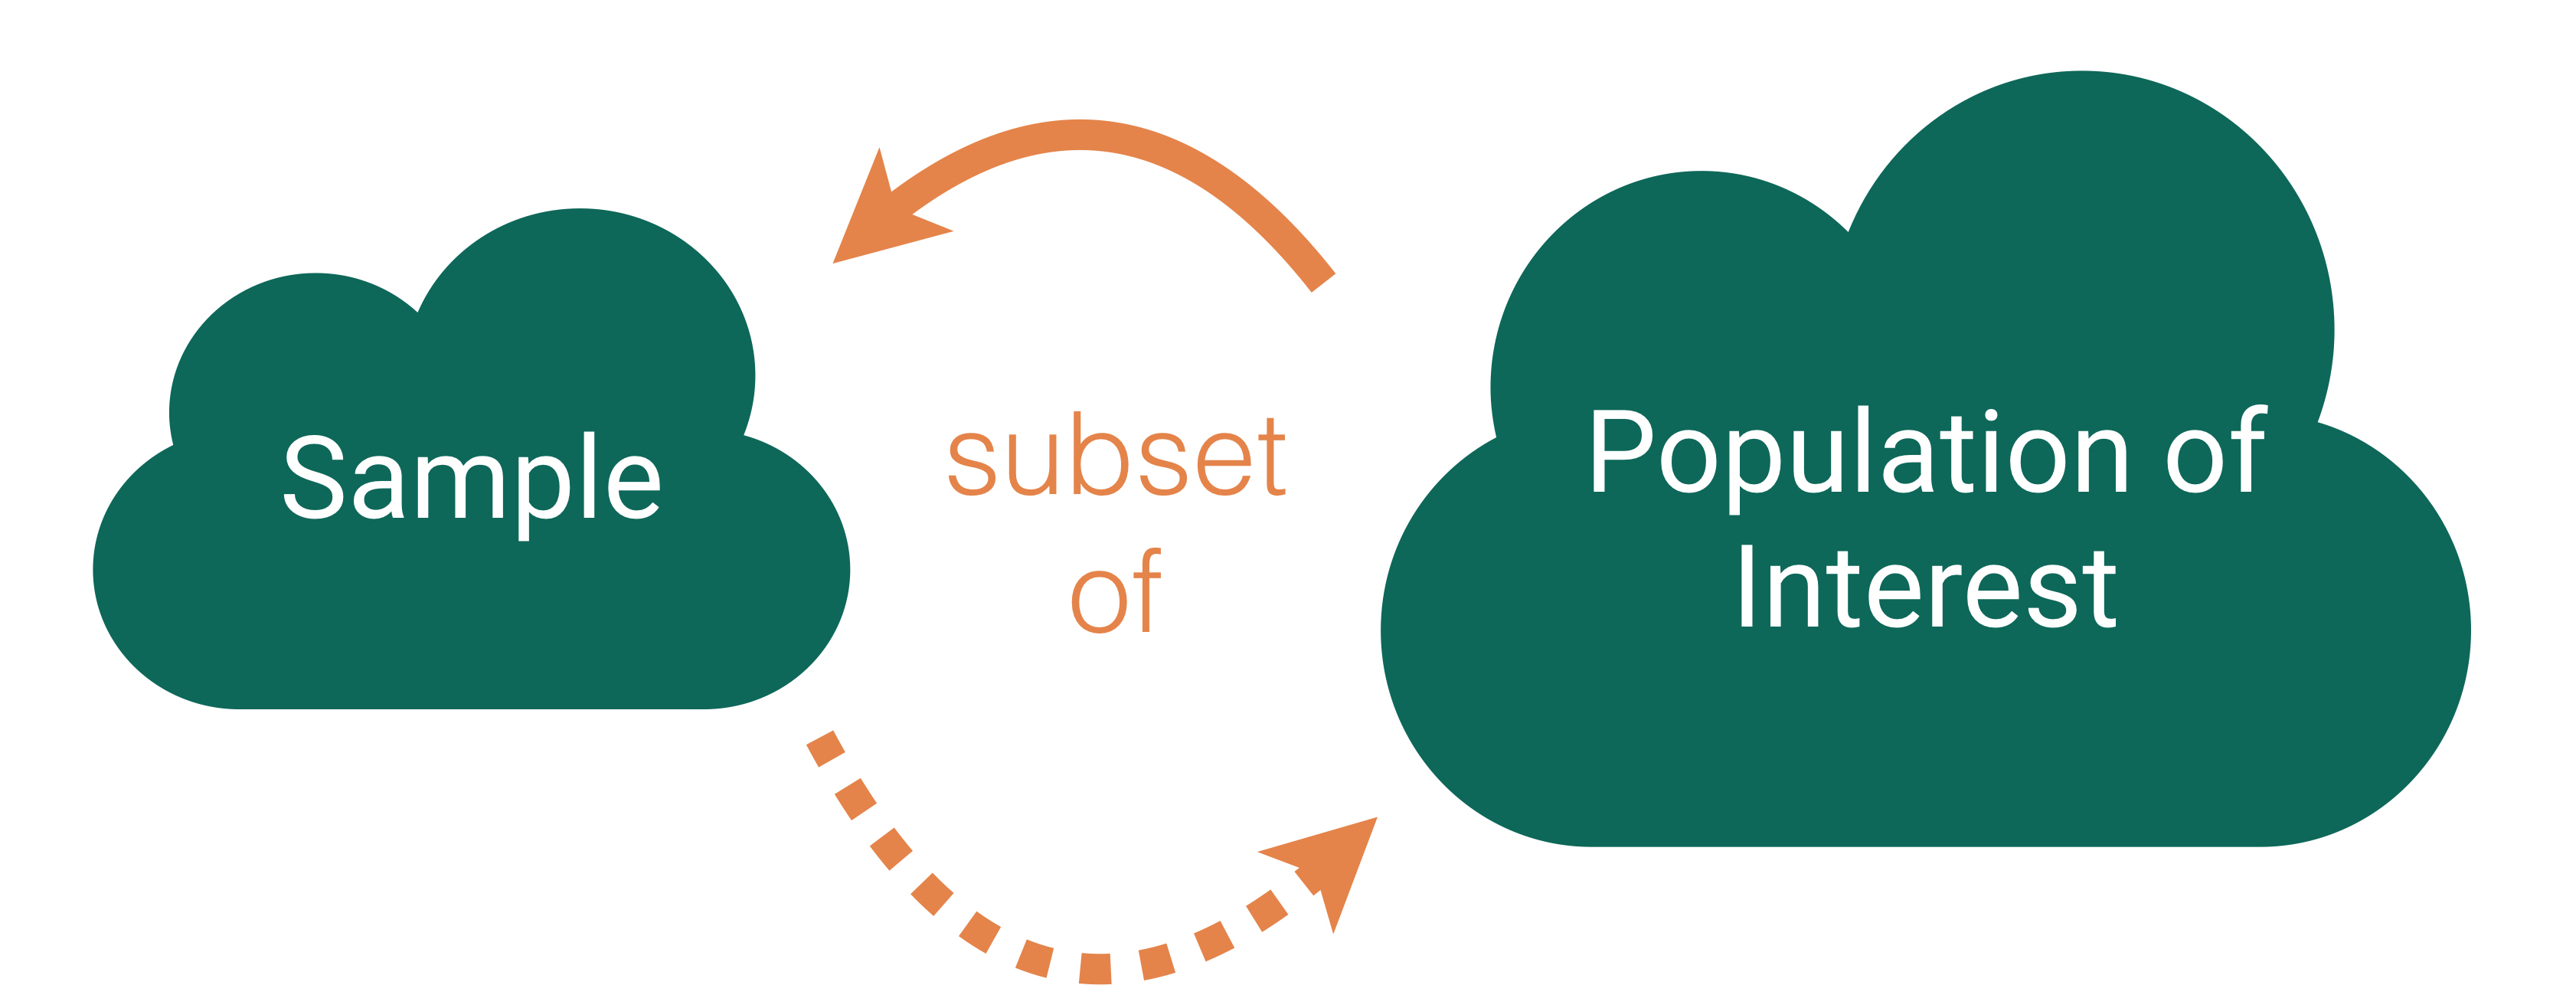
Who are the data supposed to represent?
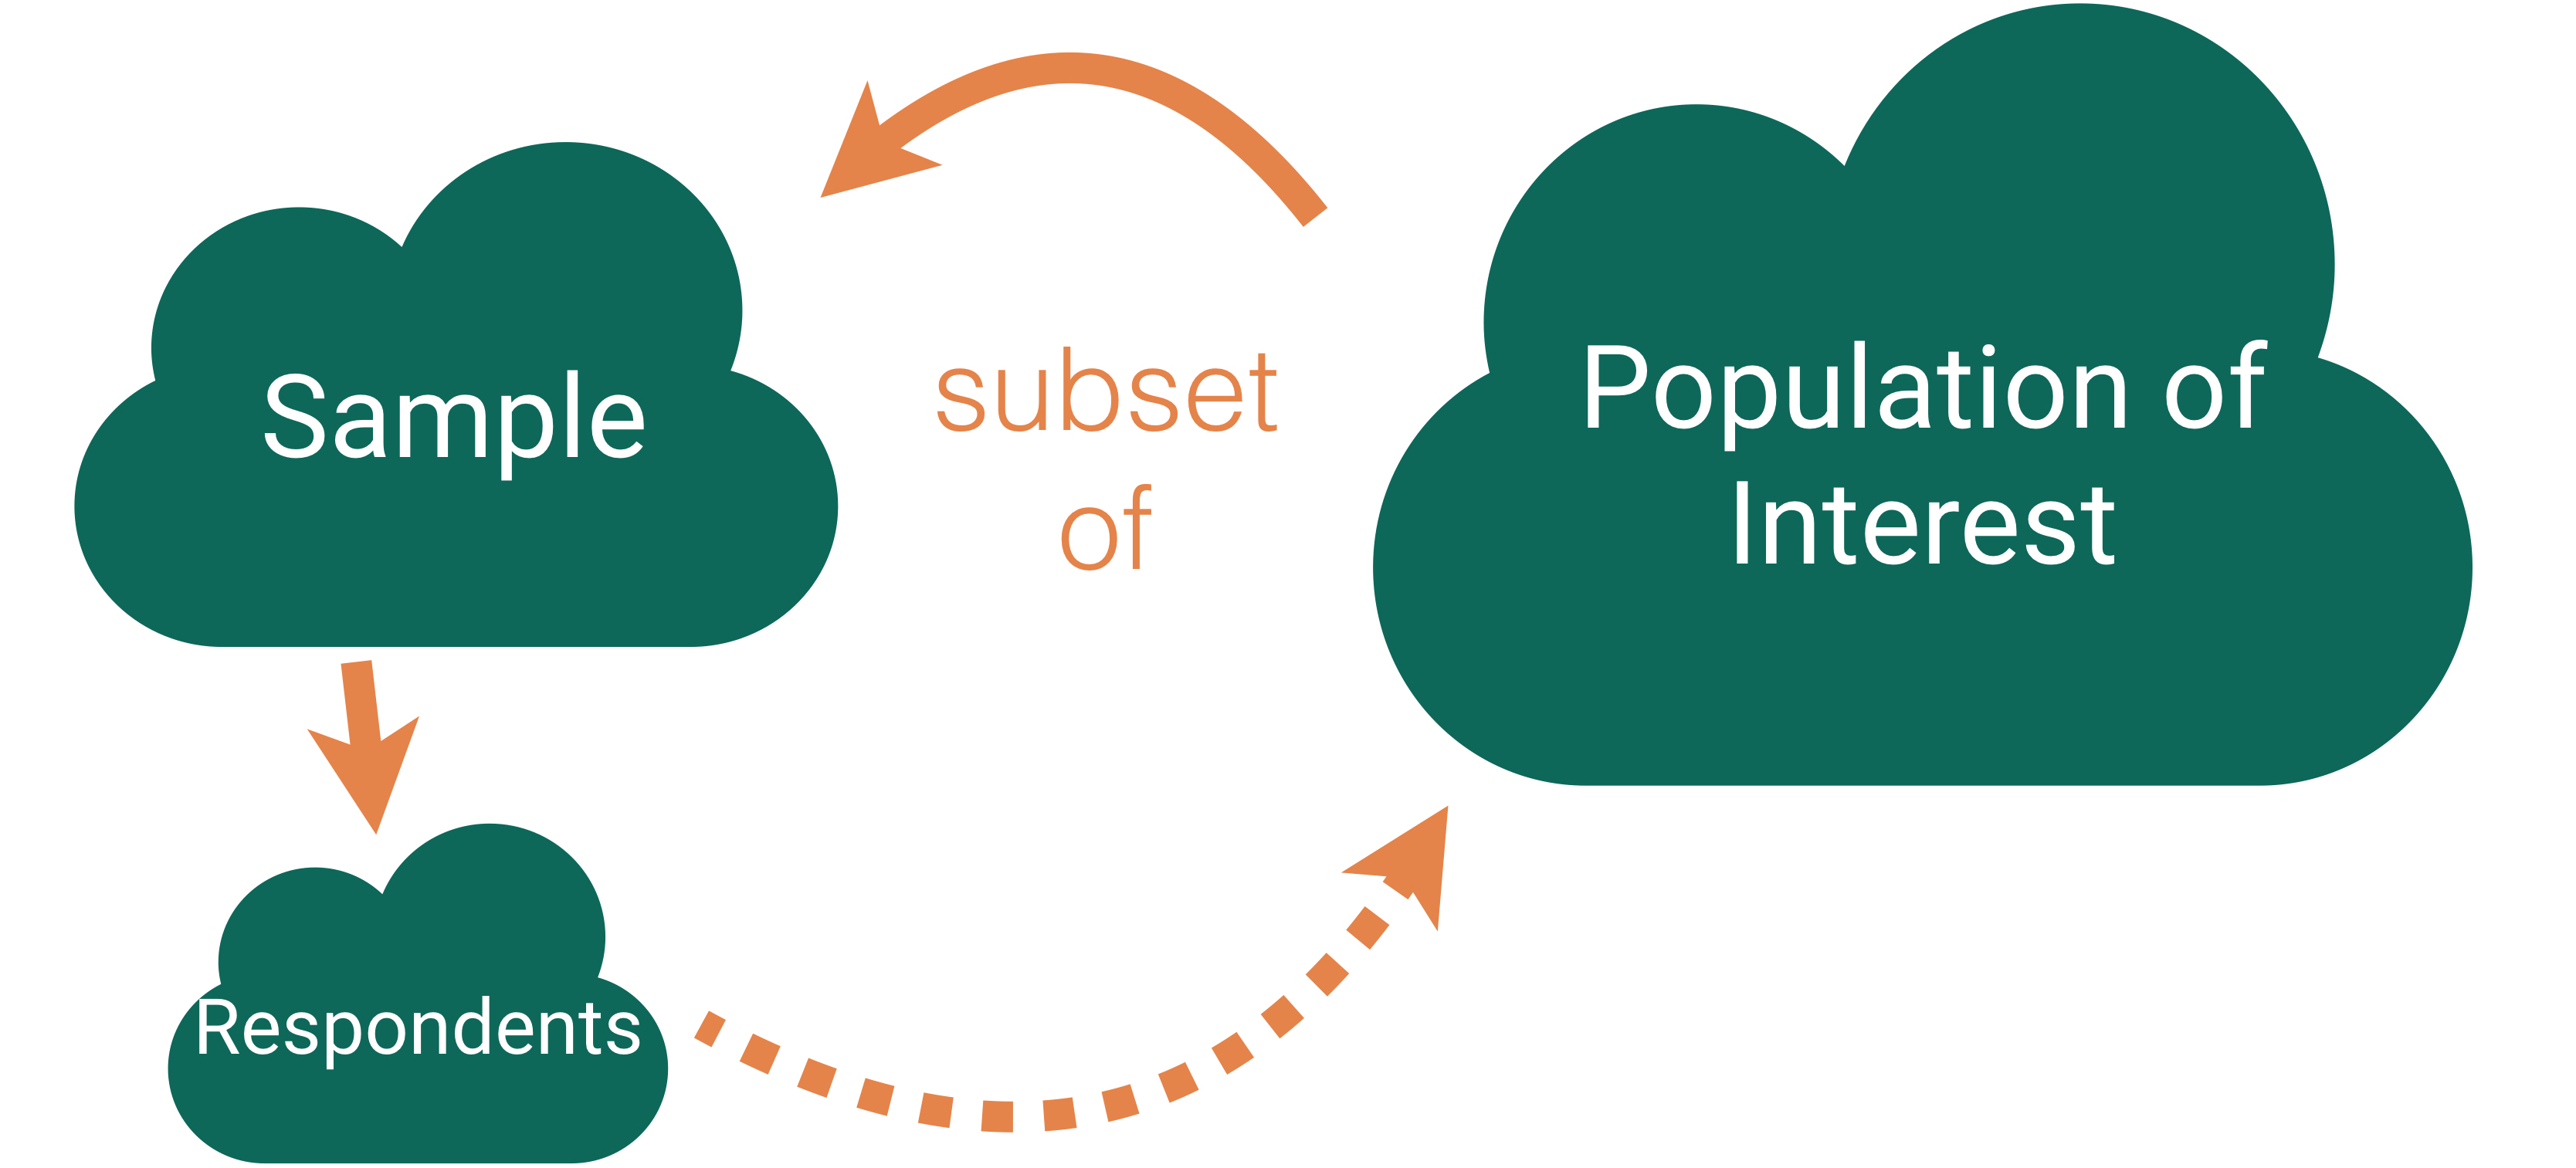
Key questions:
- What evidence is there that the respondents are representative of the population?
- Who is present? Who is absent?
- Who is overrepresented? Who is underrepresented?
Nonresponse bias
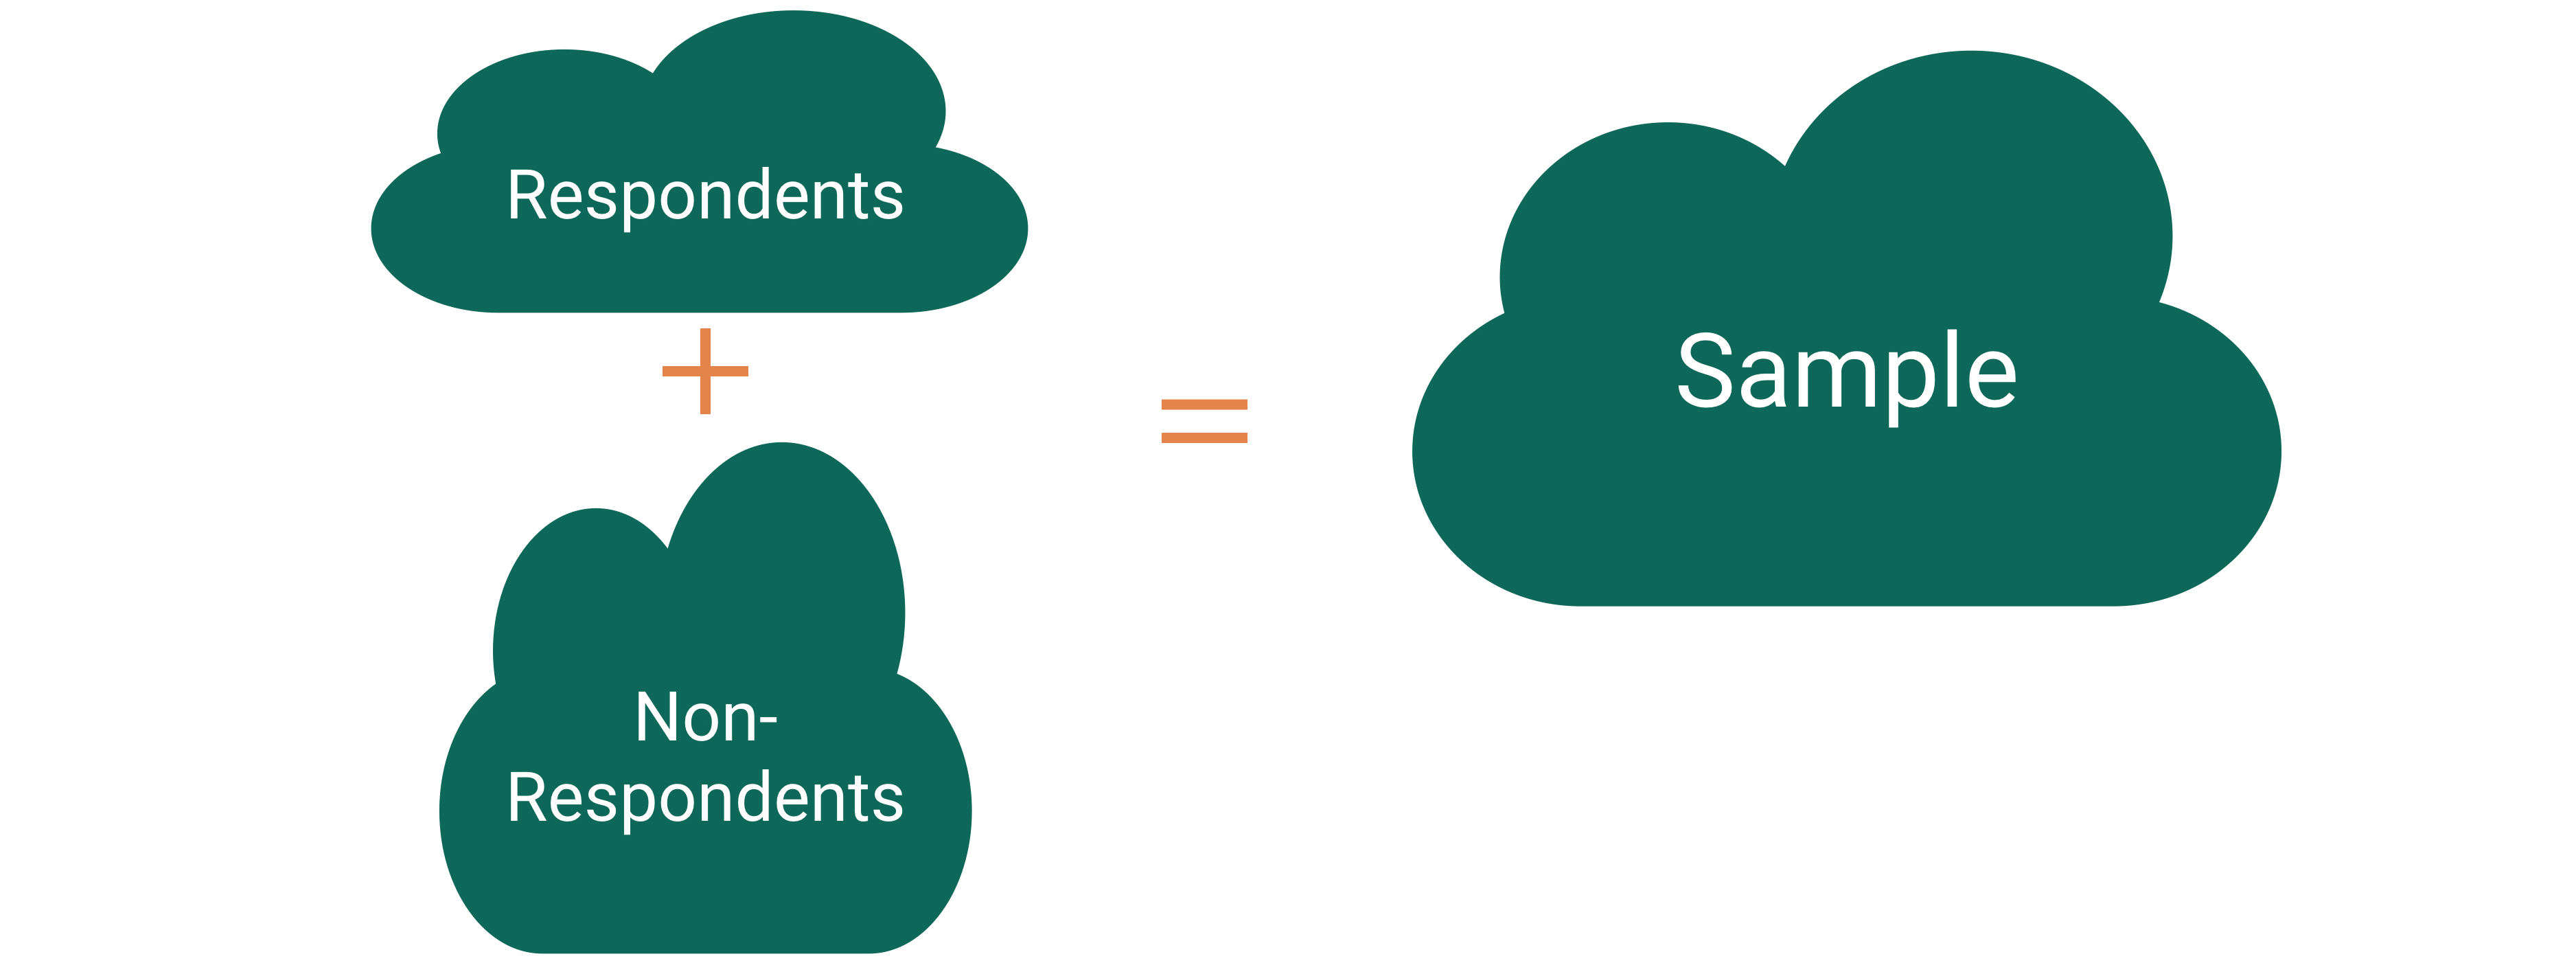
Nonresponse bias: The respondents are systematically different from the non-respondents for the variables of interest.
Tackling Nonresponse bias
Use multiple modes (mail, phone, in-person) and multiple attempts for reaching sampled cases.
Explore key demographic variables to see how respondents and non-respondents vary.
Take a survey stats course to learn how to create survey weights to adjust for potential nonresponse bias.
Is Bigger Always Better?
For our Literary Digest Example, Gallup predicted Roosevelt would win based on a survey of 50,000 people (instead of 2.4 million).
Big Data Paradox

“Without taking data quality into account, population inferences with Big Data are subject to a Big Data Paradox: the more the data, the surer we fool ourselves.” – Xiao-Li Meng
Example:
During Spring of 2021, Delphi-Facebook estimated vaccine uptake at 70% and U.S. Census estimated it at 67%.
The CDC reported it to be 53%.
And, once we learn about quantifying uncertainty, we will see that large sample sizes produce very small measures of uncertainty.
Big Data Paradox
“If you have the resources, invest in data quality far more than you invest in data quantity. Bad-quality data is essentially wiping out the power you think you have. That’s always been a problem, but it’s magnified now because we have big data.” – Xiao-Li Meng
Careful with Non-Random Assignment Data
We have data on the number of Methodist ministers in New England and the number of barrels of rum imported into Boston each year. The data range from 1860 to 1940.
- Should we conclude that ministers drink a lot of rum? Or maybe that rum drinking encourages church attendance?
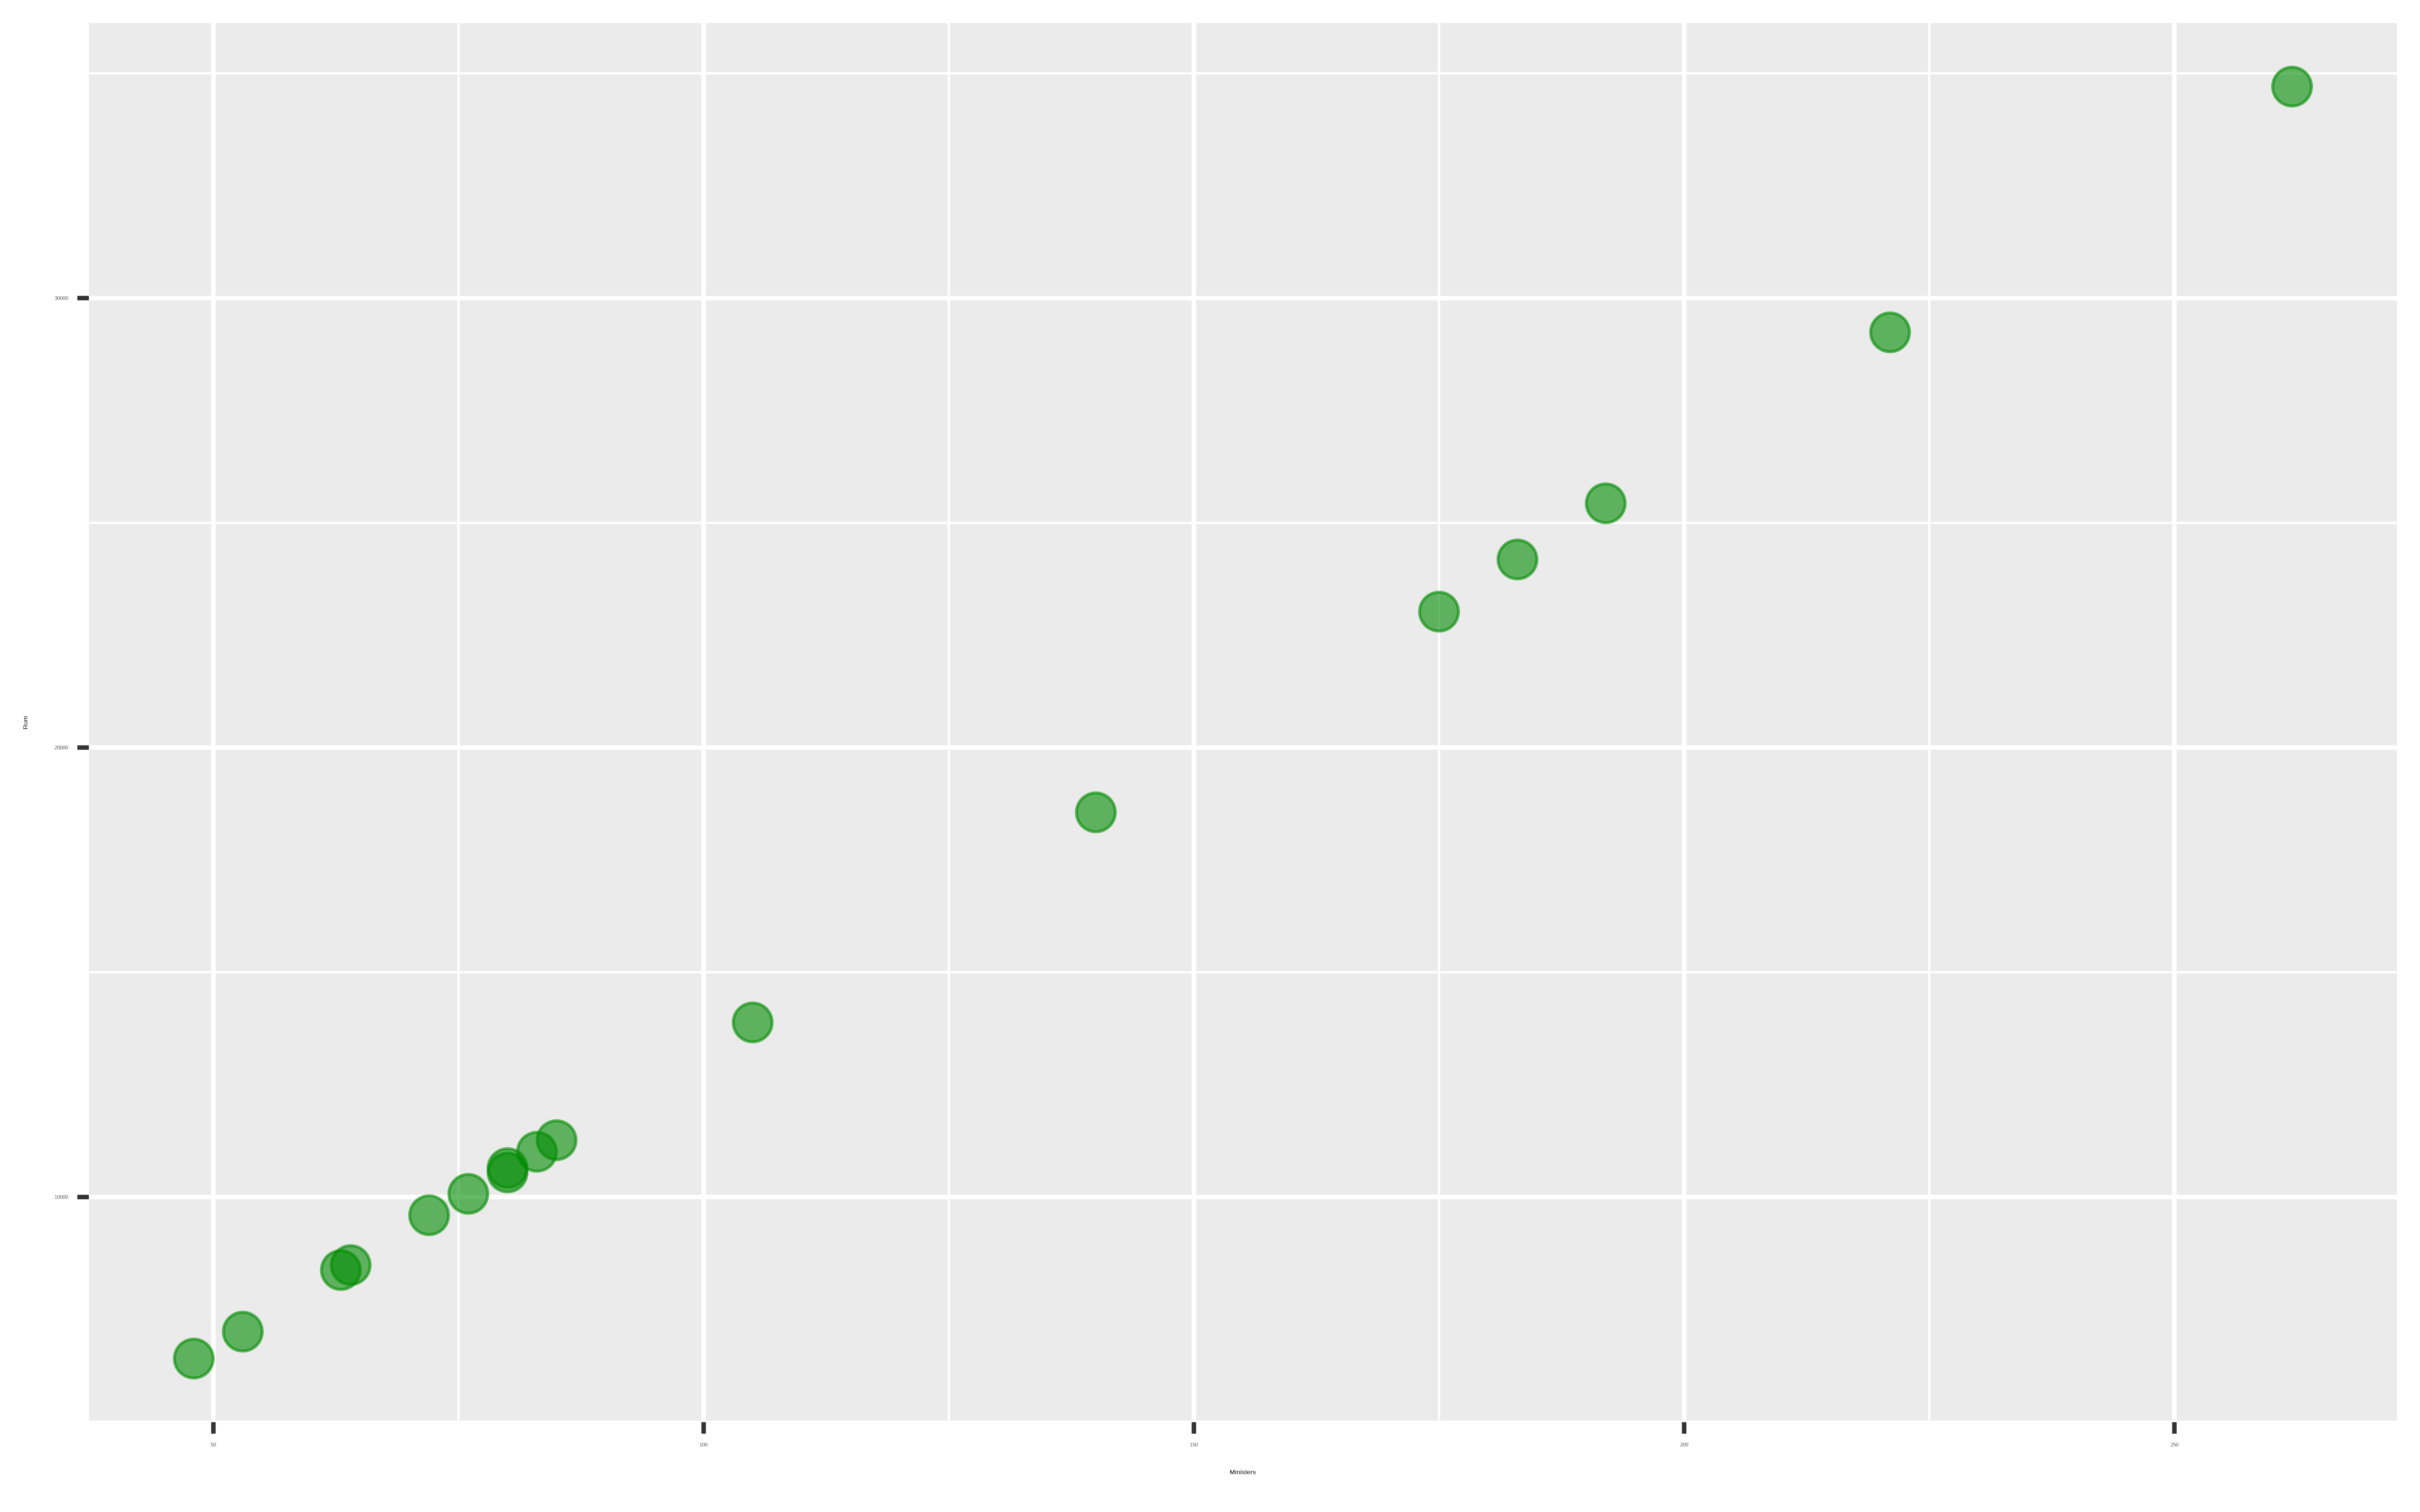
Confounding variable: A third variable that is associated with both the explanatory variable and the response variable.
Unclear if the explanatory variable or the confounder (or some other variable) is causing changes in the response.